Experimental Validation of COMSOL Results
Okay, so after navigating this weird new method for posting, I have a semi interesting post today. I have been working on the experimental validation of my COMSOL predicted capture results and have finally completed the first round of those experiments (I say this after looking at the data). The experiments have been carried out with 60 nm gold nanoparticles and chips from wafer 1298. I have chosen 5 points on the capture curve and calculated the percentage capture at each point by counting the number of particles seen in a 30 kx SEM FoV for each experiment (done in triplicate for statistical significance, 15 total samples). The values of ultrafiltration that I have chosen are 0%, 20%, 50%, 65%, and 85%.
Now, I have to step aside here for a minute and bring up a point that is crucial to how I am doing my calculations. It has been shown (a lot of Karl’s work with the particle sieving) that our membranes have extremely tight cutoffs around the average pore diameter. However, we know that the surface of these membranes consists of a large distribution of pore diameters. So when we use the pore processing software, we actually get the properties of the membrane as a whole. Now, this could be alright for the average diameter and stuff like that, but what is more important perhaps is the pore density. Now the pore density takes into account all the different sized pores on the membrane and gives us the number of pores per square micron. If I were to do a particle count and then take that number of particles per square micron and divide it by the number of pores per square micron, then I will get the average pore occupancy. HOWEVER, this is bad for the actual occupancy values. if we consider that ALL of the different sized pores are thrown into that count, the we are including pores where particles will pass through as well as pores that would reject a 60 nm particle. SO, I took the histogram for the 1298 wafer and divided it up to 10 nm increments and then counted the number of pores in the 50, 60, and 70 nm range. The original pore density for this wafer was calculated at 55 pores/μm^2. However, when I modify the calculation, I get that there are only 33 pores/μm^2 in the range that can capture 60 nm particles. This is a significant decrease and should be a standard technique for all work with gold nanoparticles.
Since I made that fairly clear, now it’s time to move on to the fun stuff. Well, basically just one thing: the results. I (with a bit of help from Dan) counted the particles on the membrane and then averaged them over all three samples. I then plotted the percentage occupancy against the percentage ultrafiltration along with their standard deviations.
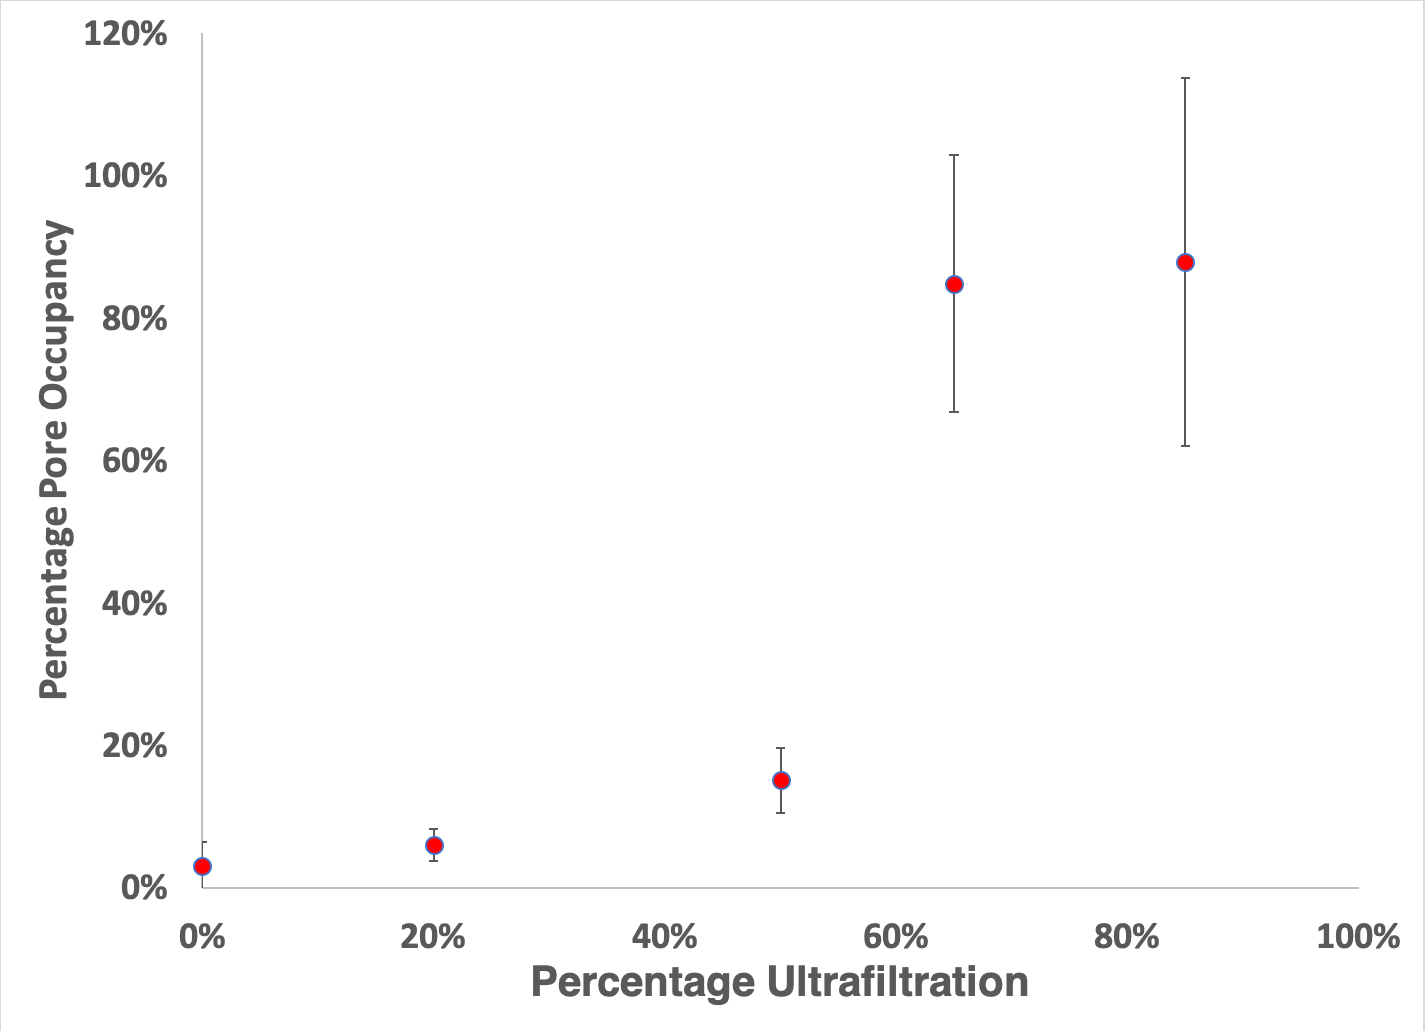
So. Well. Um. That didn’t quite go as planned. As you can see, the pore occupancy is quite poor compared to any expected results. In fact, when directly compared to the COMSOL results, it looks terrible (Figure 2). Let’s start as to why the low end is so far off of what would probably be expected.
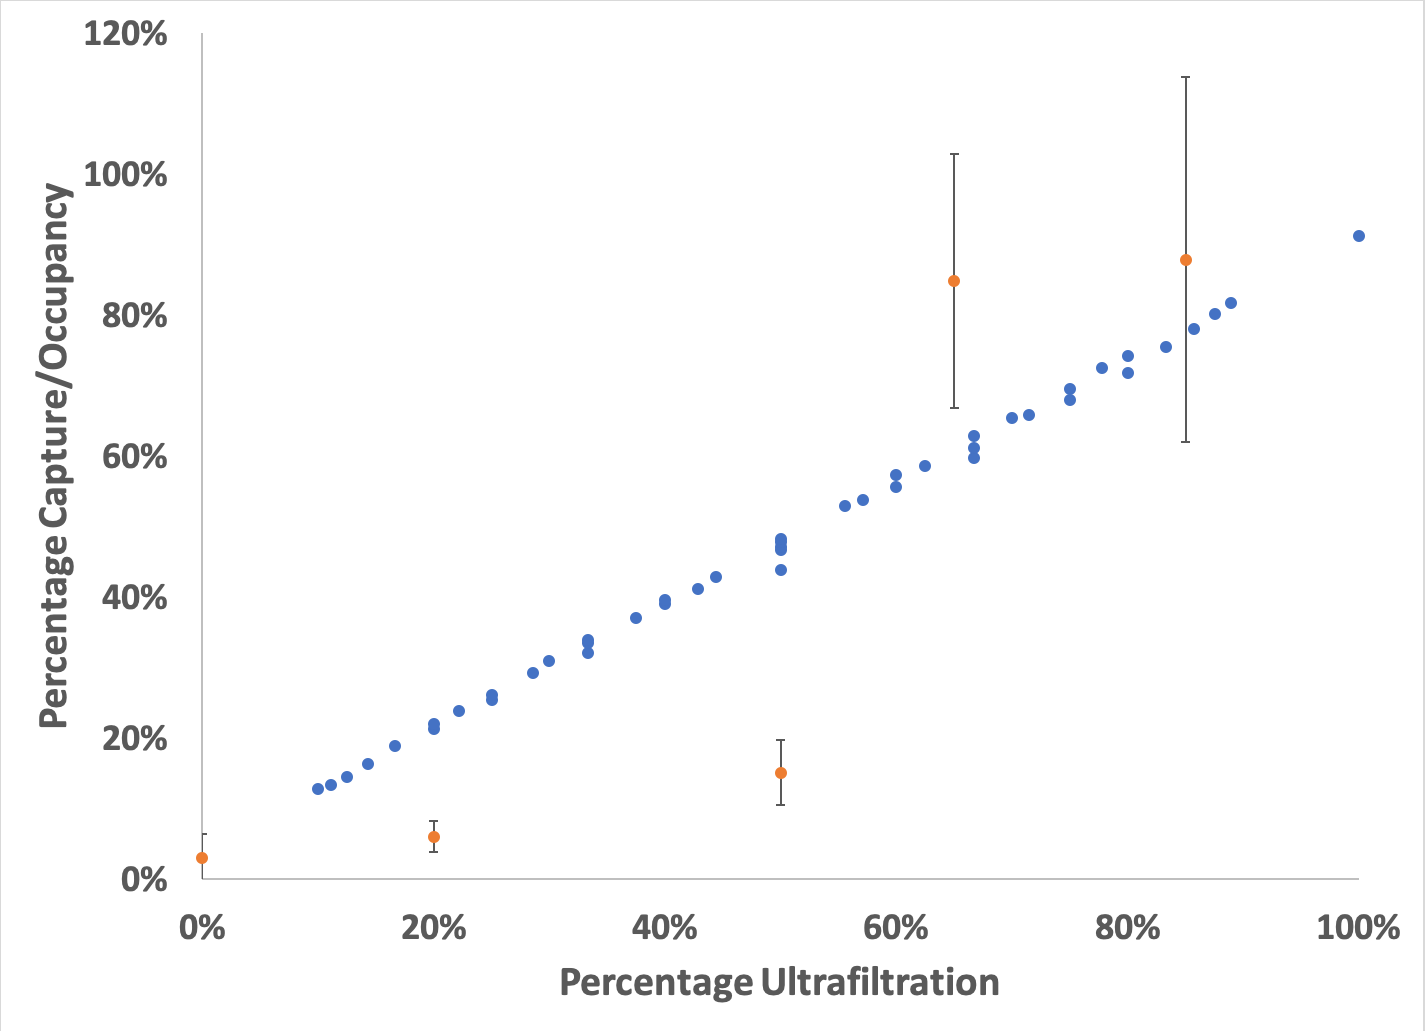
I passed ~ 500 μL of fluid over the membrane, which would have been ~ 5 x 10^7 particles total at the concentration I was using. Even at 50% ultrafiltration, we only ever capture ~ 15% of those particles. One possible reason for this is that these experiments were performed towards the end (I didn’t go fully in order) and I also noted a bit of potential leakage around the membrane, which suggests that my PDMS top piece is finally getting old, resulting in a bit of leakage. Therefore, I will be repeating these experiments with new PDMS. However, if we step up to 65% ultrafiltration, then we are capturing/occupying nearly 85% of the particles/pores. This indicates that perhaps the membrane is reaching a saturation point with both flow conditions, giving near identical capture results for two quite different conditions.
While this is a plausible explanation, I will explore the bottom of the curve again to further validate that those are the actual values. Until next time folks, have a great Thanksgiving!