Currently, no FDA approved drug exist for the treatment of sepsis. Past sepsis pharmaceuticals attempted to target mediators of the innate immune response. These drugs, however, struggled to balance remedial immune suppression from complete immune knockdown in a patient population plagued my a maladative immune system. This fundamental issues is due in part to targeting blanket mediators of inflammation, both when presented systemically as in sepsis or locally as in primary infections. To this end, discovery pharmaceutical targets that can distinguish systemic and local infections in key to the future of sepsis treatment.
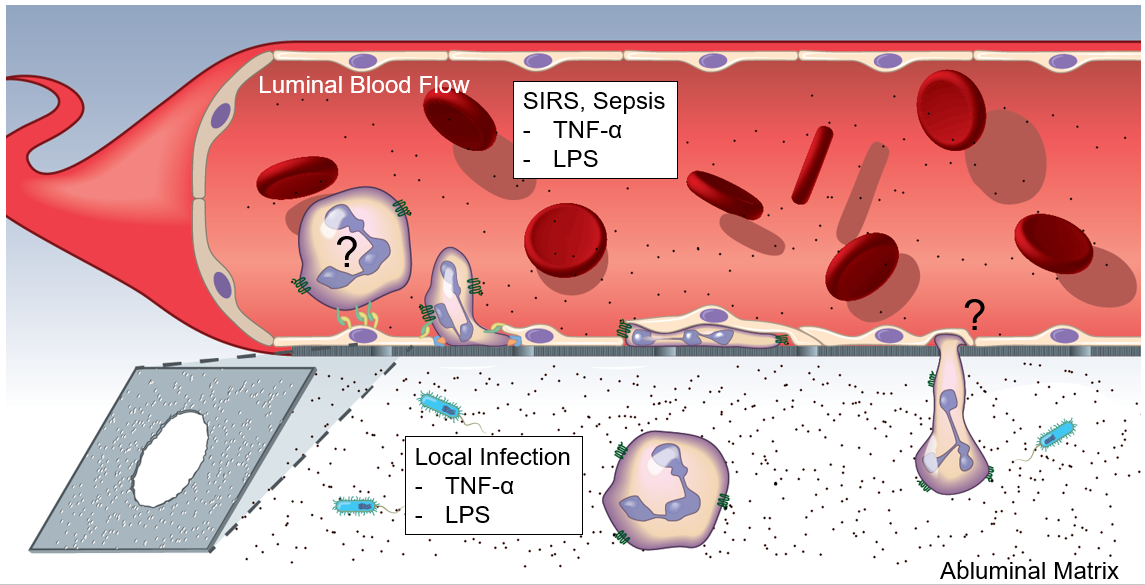
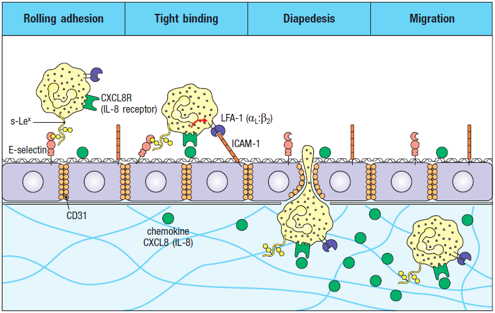
Invivo, microvascular endothelial cells present defined luminal and abluminal interfaces. In the case of primary infections, cytokines and bacterial derived endotoxins are presented to the abluminal cell interface. In sepsis, however, this signally is shifted to the lumin. We hypothesize that the apicobasal polarity of endothelial cells may regulate the innate immune response in these two scenarios, and thus present a target for the treatment of sepsis.
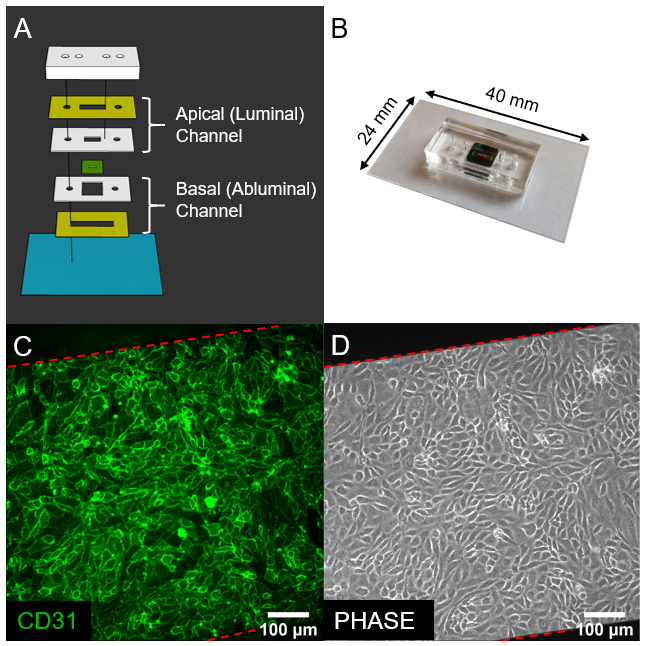
In order to test this hypothesis in a highly controlled environment, we propose the use of a microfluidic silicon membrane-enabled microvacular cell barrier model system (μSiM-MVB).
Methods
Details to come…
All experiments were performed on 75 nm NPN (1275)
TNF-α treatments were consistently 20 ng/ml for 24 h unless otherwise stated.
Automated tracking was performed in a custom written Matlab script by Jeff Tithof. Hand tracking was performed using the Manual Tracking plugin on FIJI.
TEER was performed using 1 μm PC transwell cups and a EVOM2 system with an EndOhm cup measurement chamber.
IL-8 ELISAs were performed on 3/50 diluted cell culture media samples.
Results
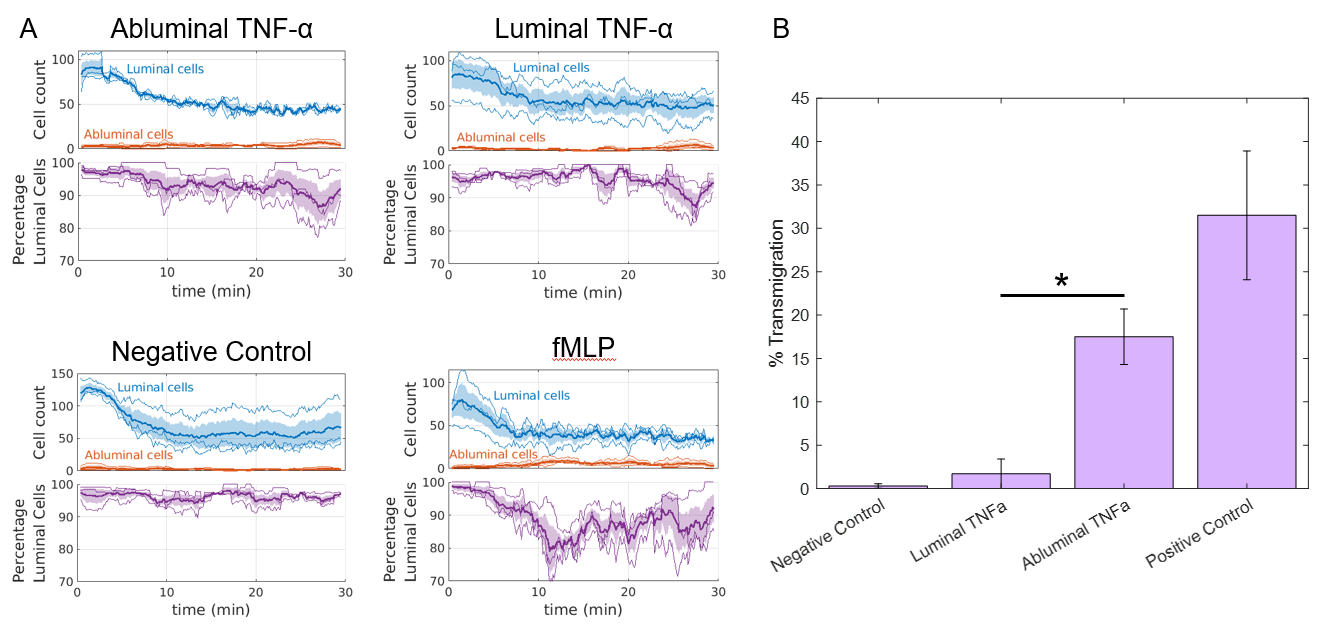
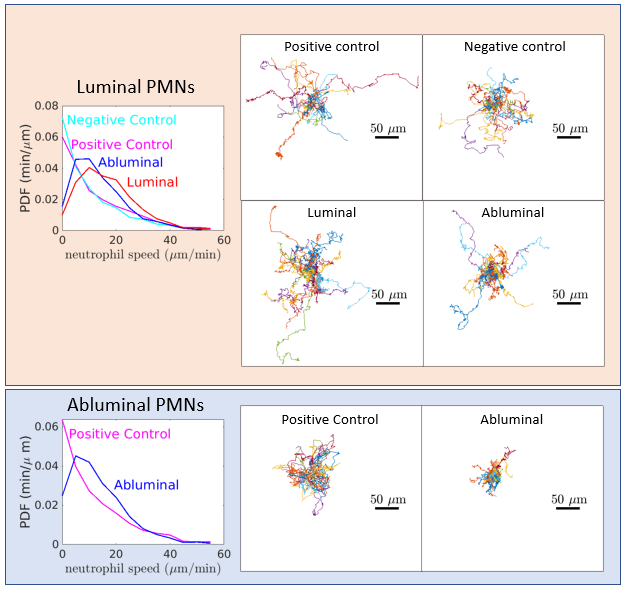
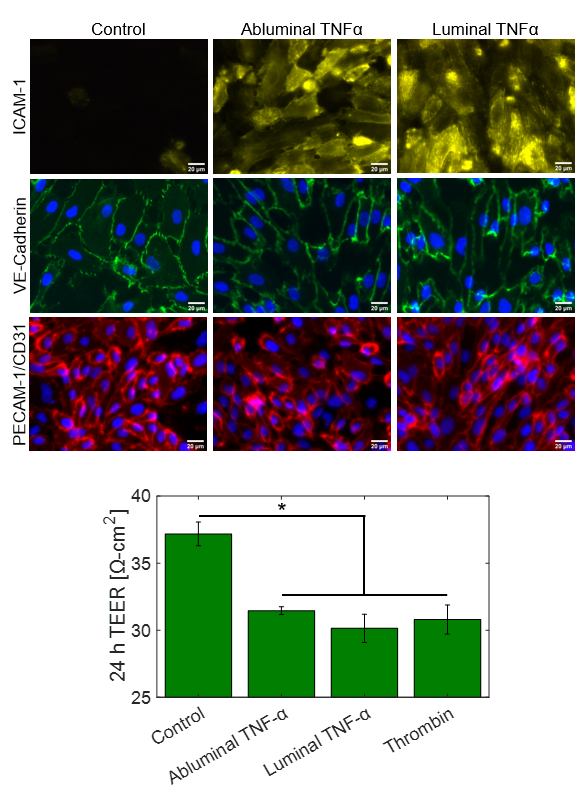
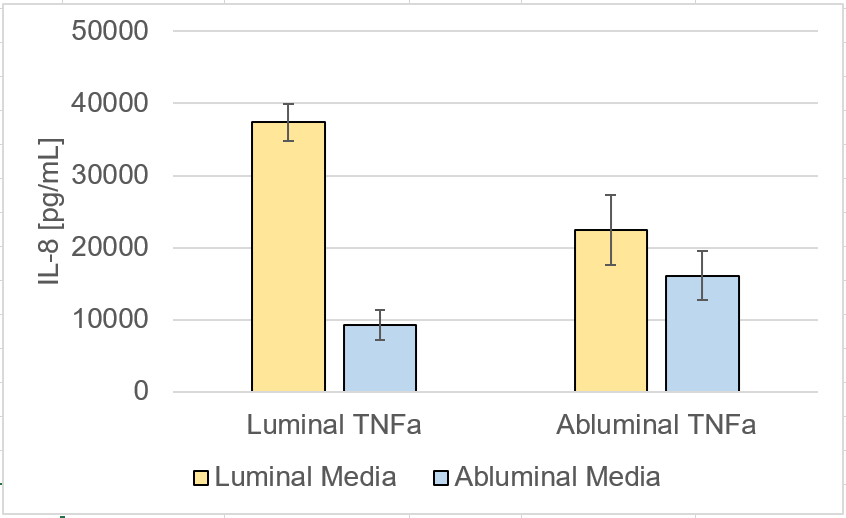
Figure 1. The μSiM-MVB for in vitro studies of the endothelium apicobasal polarity. Layered fabrication techniques produce a microfluidic device with defined top and bottom channels separated by a bio-compatible nanoporous silicon nitride membrane (A,B). The optically transparent nanomembranes permit in situ cell analysis in both fluorescence (C) and phase (D).Figure 2. Endothelial exposure to abluminal TNF-α induces a potent PMN transmigration response. Primed μSiM-MVBs were treated either abluminally or luminally with TNF-α for 24 h. Following treatment, PMNs were loaded in the μSiM-MVB’s luminal channel and time-lapse images were taken. Negative and positive (fMLP) controls were included for comparison. A custom designed automated cell tracking program determined temporal progression of PMN transmigration events (A). Hand counts of PMN transmigration events were normalized to total neutrophils observed in frame (B). Hand count results were statistically compared across experimental groups (paired t-tests; *p<0.05).Negative ControlPositive ControlLuminal TNFaAbluminal TNFaFigure 3. TNF-α increases PMN speed independent of abluminal/luminal delivery. PMNs were loaded in treated or control μSiM-MVBs and time-lapse videos were recorded. Randomly selected PMNs found migrating on top of the endothelial cell monolayer (Luminal PMNs) were hand tracked and probability density functions (PDF; A) and tracks (B) were plotted. In groups were transmigration was perviously observed, PMNs found migrating underneath the endothelial cell layer (Abluminal PMNs) were hand tracked and PDFs (C) and tracks (D) were plotted as well.Innate ImmunityFigure 4. Abluminal TNF-α induced transmigration is independent of ICAM-1 and endothelial cell permeability. Primed and treated μSiM-MVBs were fixed and stained for endothelial cell surface proteins: ICAM-1 (A), VE-Cadherin (B), and PECAM-1/CD31 (C). Cells were counterstained with DAPI (Blue) and epifluorescence images were recorded in situ. To quantify endothelial cell permeability, HUVECs grown on Transwell inserts were treated identically to μSiM-MVB groups and transendothelial electrical resistance (TEER) was recorded (D).Figure 5. Polarized secretion of IL-8 by TNF-α treated endothelial cells. Primed and treated μSiM-MVBs were removed from the incubator and cell culture media was collected from both luminal and abluminal channels. Samples were diluted and analyzed for IL-8 concentration by ELISA. [UPDATE]
On Going
Given the IL-8 ELISA results, we hypothesize that the chemokine gradient is responsible for the increase in transmigration observed in Abluminal TNF-α treatment groups. In order to further test this hypothesis, we will introduce recombinant IL-8 into control μSiM-MVBs at the observed concentrations and PMN transmigration experiments will be repeated.
Enothelium apicobasal polarity may provide an adaptive influence in innate immunity by driving transmigration through the polarized secretion of IL-8. Pharmaceutical companies interested in targeting IL-8 may benefit from this study.
Earlier this year an MIT/Harvard group generated and transplanted a rat kidney and published in Nature Medicine Technical Report. “Regeneration and experimental orthotopic transplantation of a bioengineered kidney” Jeremy J Song, Jacques P Guyette, Sarah E Gilpin, Gabriel Gonzalez, Joseph P Vacanti, & Harald C Ott Center for Regenerative Medicine, Massachusetts General Hospital and Harvard…
As a follow up to my previous post, I would like to present some preliminary data on the subject of endothelial cell alignment under shear stress with variable substrate stiffness. The flow set-up (Figure 1) allows for steady flow across the membrane on which the HUVECs are cultured. No Gel HUVEC Alignment Alignment of HUVECs…
In my previous post, I mentioned that the EA treated chips showed decreasing contact angles after their storage in water in contrast to gel-pack or vacuum container. However the EA treatment was 4 days old, and I lacked adequate controls. So this time, I chose smaller time durations to understand if this phenomenon can be…
This is kind of a shot in the dark, but I wanted to see if I could get a zeta potential for pnc-Si that was as high as predicted by the electroosmosis results. First I tried to get the membranes to break in 1mL of PBS so that the windows were floating on top of…
I fixed the graph for the serial dilution of Rhodamine that I did last week and removed all absorbency values that were greater than 1.08 AU. The graph looks much more linear now with an R^2 value of .9517