Nano-pocket Membrane Integration in Tangential Flow for Analyte Capture (TFAC) for Precise Size-Based Particle Capture
Introduction:
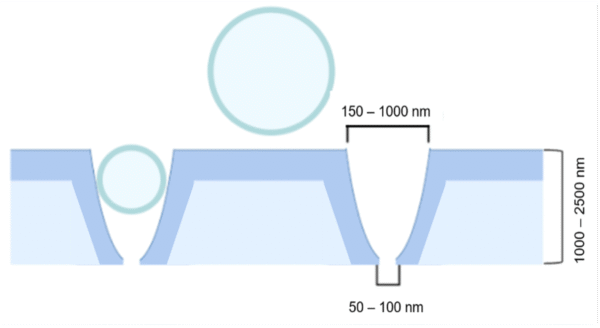
Building upon previous research conducted by the Gaborski and McGrath labs, this poster introduces a novel approach to isolate extracellular vesicles (EVs) based on size. The earlier work involved the development of a tangential flow membrane capture system to address isolation challenges. In this extension, a nano-geometry membrane is fabricated to selectively filter out EVs of specific sizes, enabling a more precise analysis of their properties and functions. The geometry is like a nano-pocket that decrease from the top to the bottom pore (figure 2). The newly designed membrane geometry is then incorporated into a tangential flow filtration device for effective particle isolation according to their size.
Fabrication Process:
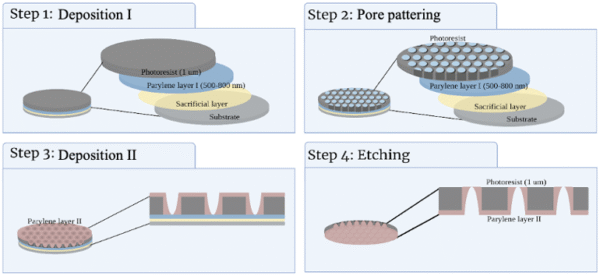
Figure 1 provides an overview of the fabrication process using the lithography approach. The fabrication process is divided into four steps: depositing I, patterning, depositing II, and etching. The first process involves depositing the layers over the Si wafer. We started by depositing a sacrificial layer (SL) to peel off the membrane in the further steps. Then a parylene layer (PAR), named parylene I in figure 1, is deposited to protect the SL layer from the next layer, the photoresist (PR) layer. Finally, a layer of PR is deposited over PAR layer I. To validate the parylene deposition, a NanoSpec spectrophotometer is used to measure the PAR thickness.
The final nano-pocket membrane shape should have a wide opening (500-700 nm) on top that narrows down to a smaller opening on the bottom side (50 to 150 nm), with a thickness in a range of 1.5 to 2.5 µm (figure 2).
Nano-pocket Membrane Fabrication results:
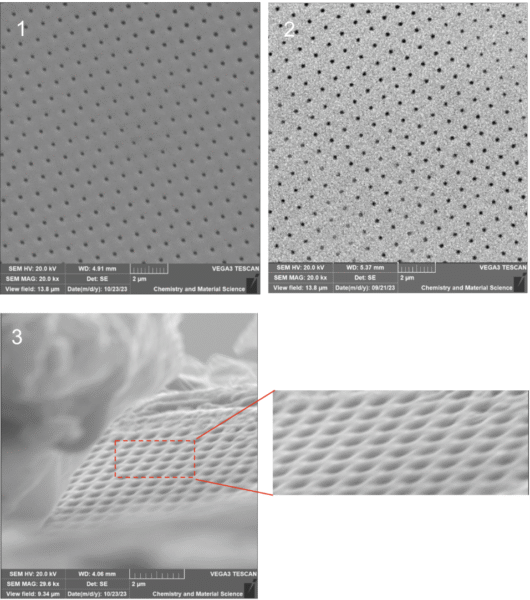
This section offers a comprehensive visual representation of the membrane from multiple perspectives. Figure 3 a) present a top view of the membrane while attached to the wafer, highlighting top pore sizes ranging from 500 to 600 nm. Additionally, in (b) examine the backside view of the membrane after etching, revealing pore sizes within the range of 150 to 250 nm. Finally, a side view ( c) of the membrane while attached to the wafer presents the soft edge of the membrane. These diverse angles provide an in-depth understanding of the membrane’s structural attributes and features within the context of our study.
Tangential Flow for Analyte Capture (TFAC) Device Design:
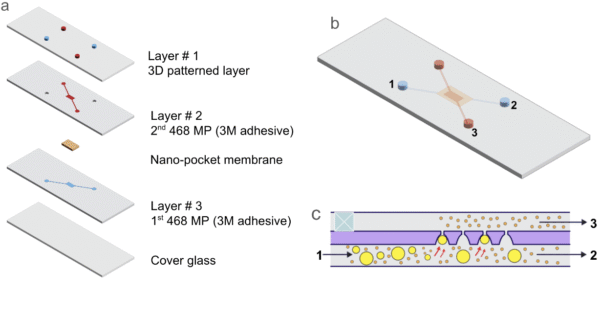
Figure 4 shows the various layers of the microfluidic device. At the top, a 3D-printed component features chambers thoughtfully designed to accommodate standard microfluidic tubing connectors. These chambers form a seamless connection with the succeeding components, two precisely aligned adhesive layers, with a nano-pocket membrane expertly ensconced between them. To ensure the device’s integrity and to prevent any potential leakage, a cover glass is meticulously affixed at the bottommost layer. This layers results in the successful creation of the fully assembled microfluidic device, as depicted in figure 4b. Furthermore, the orientation of the membrane’s larger opening facing downward, as depicted in figure 4c, is of paramount importance. Finally, the numerical designations assigned to ports b and c underscore their identical functionality, serving as both the inlet and outlet for the device.
TFAC Device Results (Dead-End mode):
- Dye experiment
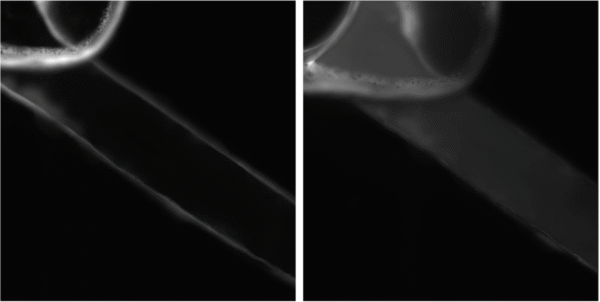
In Figure 5, an image of channel 3 is shown the left image taken prior to the introduction of rhodamine 123 dye and the right image captured 17 minutes after the dye’s administration. Evidently, the channel undergoes a noticeable increase in brightness subsequent to the dye’s introduction.
- 500 nm red beads experiment:
- Capturing step
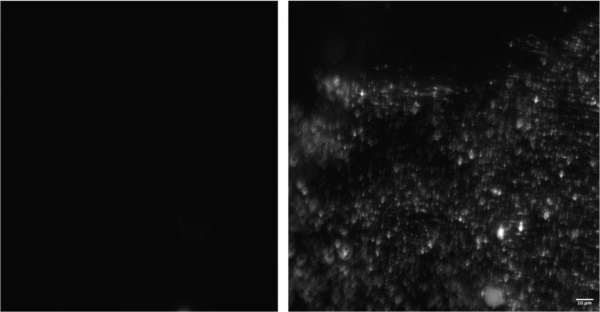
The capture of 500 nm beads on the membrane is demonstrated in Figure 6. The left image offers of the membrane’s condition prior to the capture step, while the right image distinctly illustrates the membrane’s effective capture of 500 nm beads following a 10-minute bead pumping process. These images provide clear evidence of the successful capture of the specified particles by the membrane under the prescribed conditions.
- Releasing step
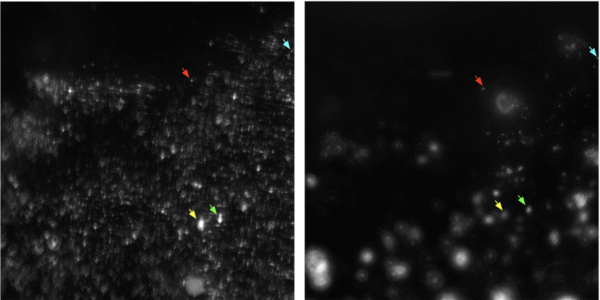
Figure 7 offers a visual representation of the release of beads from the membrane. The left image captures the membrane’s prior to the release procedure, while the right image reveals the beads following their release. The arrows within these images highlight specific particles and, at times, clusters of particles reinforcing the notion that these images focus on the same location, unequivocally indicating the release of specific particles. This observation underscores the membrane’s capacity to release particles, providing valuable insights into its dynamic functionality.
Beads Orientation:
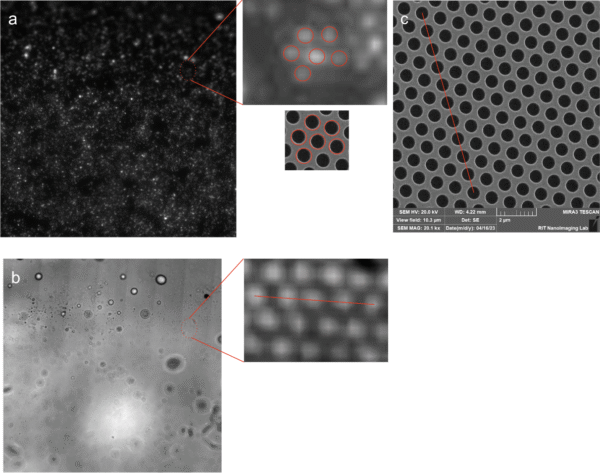
During the capture step, we observed that the beads exhibited an orientation on the membrane that closely resembled the orientation of the mask. Figure 8(a) presents a visual representation of bead orientation on the membrane during the capture step in fluorescent mode. Furthermore, Figure 8(b) provides a clear view of the orientation of the pores on the membrane, while Figure 8(c) reveals the patterning mask. Notably, all three images confirm that the distances between the centers of the pores average approximately 0.8 to 1.1 µm. These results support the successful alignment of the beads and the membrane with the desired orientation, as facilitated by the mask during the capture process.
Next step:
The subsequent phase of our investigation aims to establish the membrane’s capacity to capture and release particles employing TFAC mode. This step in my research is designed to provide evidence of the membrane’s functionality in the dynamic process of particle capture and release.