Exploring Urinary EV Detection Using CAD-LB
Introduction
This post provides an update on a series of experiments conducted with Sam. These experiments were designed to assess the versatility of the CAD-LB platform for detecting EVs in urine samples. Urine is a complex biofluid often used in clinical diagnosis, making it a suitable subject for testing the CAD-LB’s biomarker detection capabilities. After blood, it is the second most commonly used biofluid in clinical diagnosis. The goal of these experiments was to determine the effect of sample processing on EV detection and evaluate CD9 expression in urinary-derived EVs. This project was undertaken because urinary-derived EVs have great potential in the prognosis and diagnosis of kidney and genitourinary diseases, and biomarkers associated with such EVs have been involved in the investigation of such diseases (Erdbrügger et al., 2021).
Experimental Approach
Four different urine samples were used for this study: supernatant of raw urine centrifugated at 4,600g (SN4.6), pellet of SN4.6 centrifugated at 20,000g and washed once in HEPES buffer (P20 1X), pellet of SN4.6 centrifugated at 20,000g and washed three times in HEPES buffer (P20 3X), and supernatant of the first 20,000g spin ultracentrifuged (164,000g) and resuspended in HEPES buffer (P100). First, all samples were labeled with CFSE and diluted accordingly to obtain an approximate EV concentration using CAD-LB. Additionally, p20 3X and p100 samples were evaluated for CD9 expression using CFSE and an antibody targeting CD9. CFSE and CD9 incubations were carried out for 15 minutes at 37°C and 45 minutes at room temperature, respectively. Label-only samples were included to assess background labeling and capture. Isotype controls were employed in CAD-LB experiments to assess non-specific labeling levels.
Results & Discussion
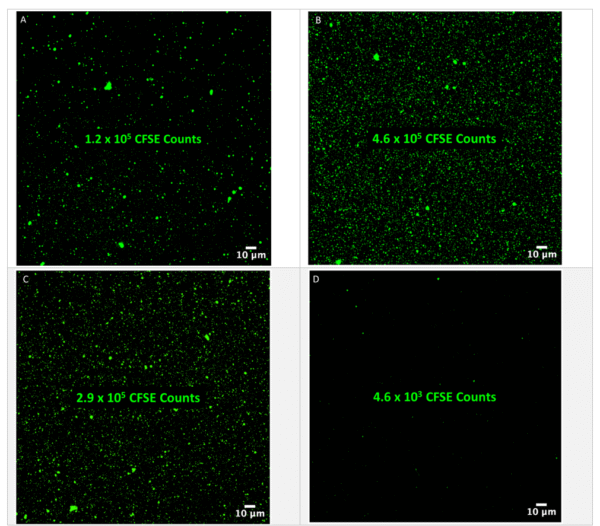
The samples were first labeled with CFSE, and the results are shown in Figure 1. The observation that the highest CFSE counts were detected in p20 1x, which underwent fewer washes and thus potentially retained more EVs, aligns with expectations. However, the apparent lack of protein contamination observed in p20 1x is surprising, given that it was not subjected to stringent washing procedures like p20 3x. It was unexpected that cell-free urine (SN4.6) displayed higher CFSE counts as compared to P100. It is worth mentioning that the cell-free urine exhibited a considerable labeling density of CFSE.
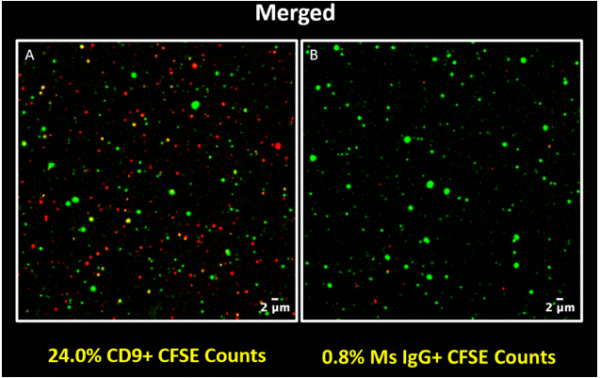
The results obtained for the p20 3x samples are shown in figure 2. CAD-LB successfully detected EVs in the p20 3x sample with good specificity from comparing the colocalization observed in the isotype control (Figure 2A & 2B).
Consistent with the result obtained for the p20 3x sample, the p100 sample also showed good specific labeling of EVs (Figure 3A & 3B).

The experiments conducted demonstrated the adaptability of CAD-LB biomarker detection as well as the ability to detect urinary EVs using CAD-LB with minimal processing. Furthermore, optimizing sample dilution can possibly allow for a higher number of EVs to be recorded using CAD-LB. Potential future developments of this project may involve the creation of a method to detect disease-specific antibodies in urinary extracellular vesicles through multiplexing.
References
Erdbrügger, U., Blijdorp, C. J., Bijnsdorp, I. V., Borràs, F. E., Burger, D., Bussolati, B., Byrd, J. B., Clayton, A., Dear, J. W., Falcón-Pérez, J. M., Grange, C., Hill, A. F., Holthöfer, H., Hoorn, E. J., Jenster, G., Jimenez, C. R., Junker, K., Klein, J., Knepper, M. A., … Martens-Uzunova, E. S. (2021). Urinary extracellular vesicles: A position paper by the Urine Task Force of the International Society for Extracellular Vesicles. Journal of Extracellular Vesicles, 10(7). https://doi.org/10.1002/jev2.12093