EV Enrichment with Izon qEV Column
Introduction
This post will describe the preliminary work I have completed using size exclusion chromatography (SEC) for EV enrichment. We are ultimately interested in interrogating serum EV biomarkers using CAD-LB, however, the presence of protein and lipoprotein contaminants reduces the capacity for EV capture (~104) on NPN membranes and may hinder the analysis of rare biomarkers. SEC can eliminate large proportions of protein and the smaller subset of lipoproteins in serum samples, thus permitting higher EV inputs for CAD-LB. In these experiments the qEV Automatic Fraction Collector (AFC) and accompanying qEVoriginal 70 nm columns were purchased from Izon and used for EV enrichment. Izon reports that qEVoriginal 70 nm columns can generate a set of fractions enriched in EVs, and here we used CAD-LB to confirm the expected enrichment.
Experimental Approach
Bladder cancer patient serum samples were purchased from Discovery Life Sciences and prepared for column enrichment according to Izon recommendations; namely, samples were pre-cleared by centrifugation (10,000 x g for 10 minutes). 400-500 µL of pre-cleared serum was loaded into qEV columns and 400 µL fractions were collected by the AFC. The Izon-reported EV enriched fractions (4 total), as well as fractions outside of this range, were labeled with CFSE and CAD-LB was used to determine EV concentration and capture capacity. This work was also repeated with a platelet-poor plasma (PPP) (plasma centrifuged two times @ 2,500 x g for 15 minutes) pooled sample collected from naive mice to ensure that enriched fractions were consistent between species.
Results & Discussion
The expected elution profiles for EVs as well as serum protein are shown in Figure 1.

According to Izon, the four fractions of interest (Figure 1: largest pink bars) should be collected after 2.9 mL of buffer volume is discarded. These fractions should be enriched in EVs as well as similarly sized particles found in serum. Representative images of the fractions collected from one patient serum sample are shown in Figure 1A-C. The pooled Izon-reported enriched fractions (presumed EV) resulted in ~105 counts upon sample dilution and capture (Figure 2B). Interestingly, the fraction preceding the presumed EV fractions (-1 EV) resulted in slightly higher counts also in the 105 range (Figure 2A).
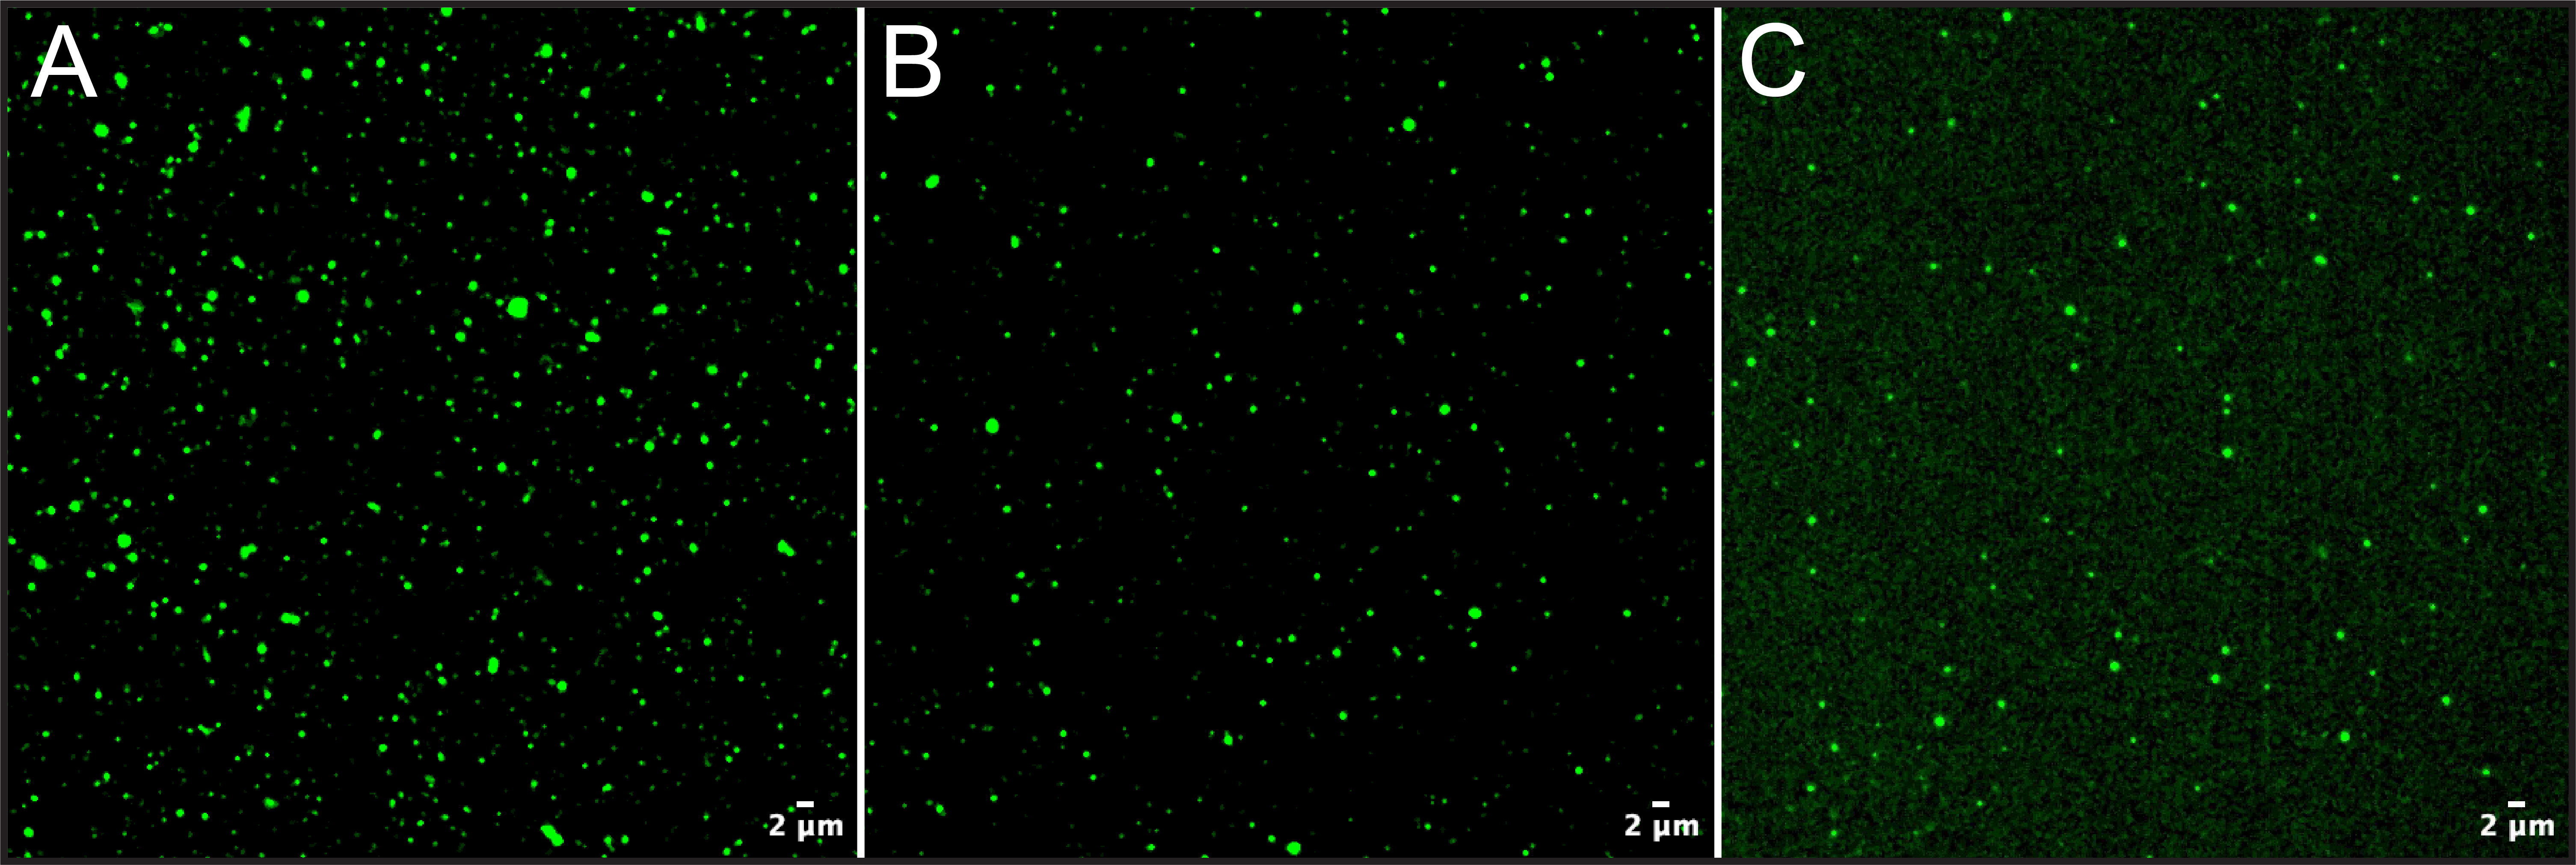
Investigating fractions outside this range confirmed that the EV elution peak was captured within -1 EV and presumed EV fractions; samples collected preceding the -1 EV fraction (-2 EV) and immediately following the presumed EV fractions (+1 EV) revealed an order of magnitude reduction of CFSE counts. In addition to lower CFSE counts the +1 EV fractions was accompanied by increased fluorescence background which may indicate the presence of eluted protein that has been nonspecifically labeled. This process was repeated again using a serum sample from another patient and consistent results were obtained.
To establish the use of the Izon qEV column with mouse samples, PPP was pooled from two naive mice and a similar fraction collection process was carried out. In this experiment, fractions were not pooled but analyzed individually to determine the contribution of each fraction. The EV count across the fractions collected are shown in Figure 3.
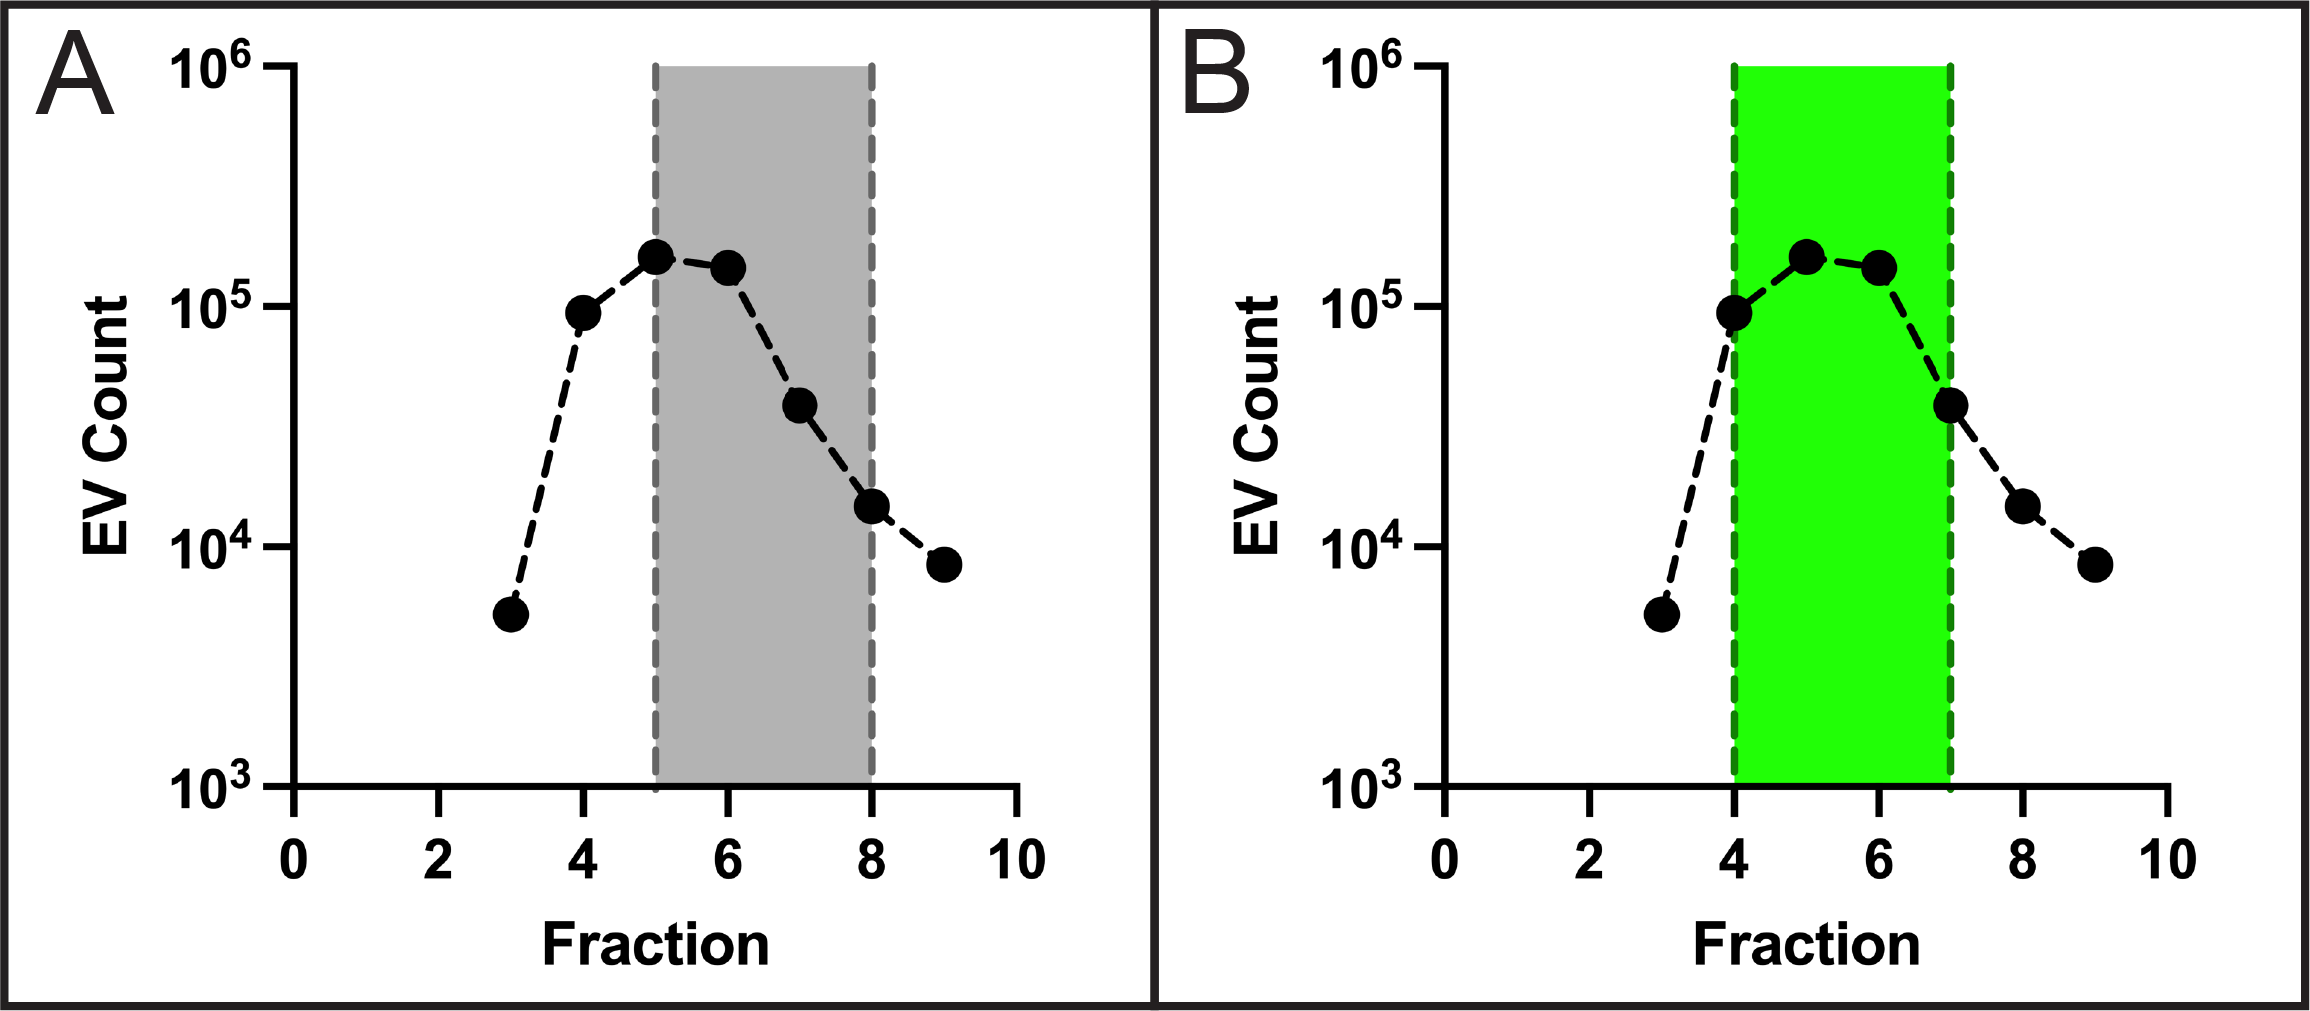
The highest EV counts were observed in fractions 5 and 6 (the first two fractions collected in the presumed EV fractions), however, only collecting presumed EV fractions (Figure 3A: gray region) would omit the -1 EV fraction which resulted in similar counts. Since we observed a clear shift in the elution profile of EVs towards earlier fractions we propose to collect -1 EV and the subsequent three fractions (Figure 3B: green region). In this manner we will be confident that the EV elution peak is captured and that contamination from protein elution is avoided.
The qEV column EV enrichment process is valuable because it greatly reduces the amount of contaminating protein and lipoproteins in complex blood-based samples. First, this allows us to increase the capture capacity of CAD-LB by at least an order of magnitude (previously limited to ~104), and may permit the detection of rarer EV subsets. Additionally, enrichment may generate more usable samples for other analytical techniques for biomarker discovery including methods like mass spectrometry and nano-flow cytometry.