Bradford Assay to Quantify Protein Retention During Desalting
The ultimate experimental goal of the desalting project is the removal of salts from a salt/protein solution while fractionating certain sized proteins with maximum protein retention and recovery.Thus far we have characterized the flux of salt through our membranes which show flux an order of magnitude greater than cellulose membranes. Our next step is to dialyze a protein/salt solution, measuring flux and protein retention over time.
During desalting we measure the amount of salt that has left the SepCon, as the conductivity probe we have is too large to fit inside the units to measure the amount of salt remaining. Dilution of the salt solution in the SepCon to measure salt concentration remaining is not currently possible, as the dilution needed to produce a large enough volume to read takes the concentration of salt below the range of the conductivity probe. As mentioned above flux is not the only parameter we are concerned about during desalting, we also would like to know the amount of retained protein. Given the limitations we face in measuring salt concentration in the protein solution, it would be beneficial to have an assay to quantify the amount of protein retained that does not vary at different salt solutions. (On a side note, does anyone know if mini-conductivity probes exist?)
The Bradford Assay is a colorimetric protein assay commonly used in biology to quantify the amount of protein in solution. The assay/protein solution changes color based on the amount of protein present. Typically, the more protein there is the darker the solution gets, measured at 595nm on the spectrophotometer as an increase in absorbance. To see if the absorbance measured using the Bradford Assay changes for different salt solutions I ran three bovine serum albumin (BSA) standard curves (ranging from .05-1 mg/mL) in 0M, 1M, and 4M NaCl in deionized water. I have run this multiple times to refine the procedure; the “best” curves are shown below. These graphs have standard deviation bars, but are too small to see.
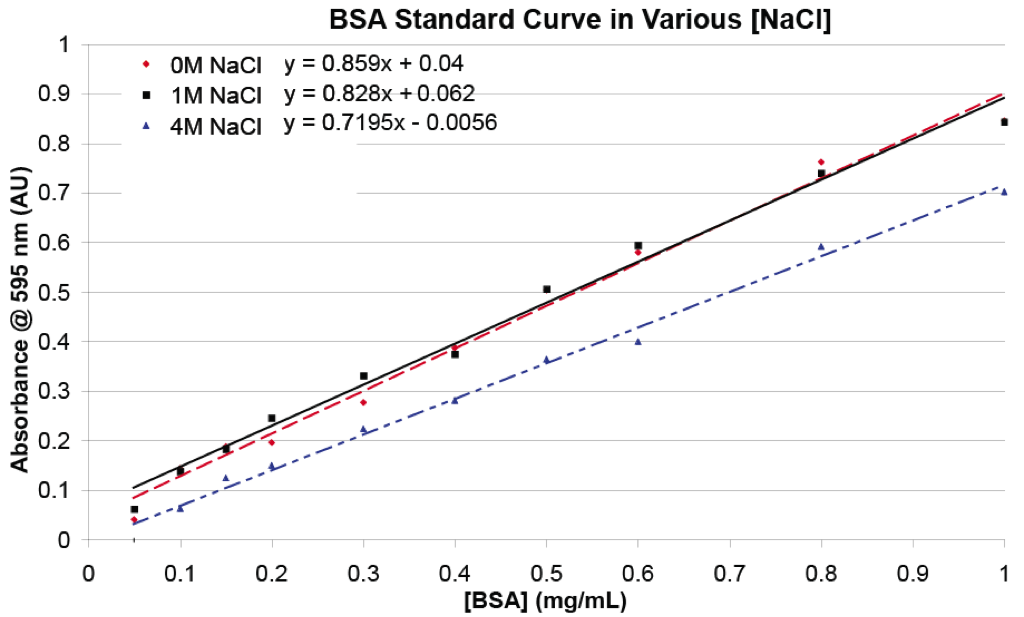
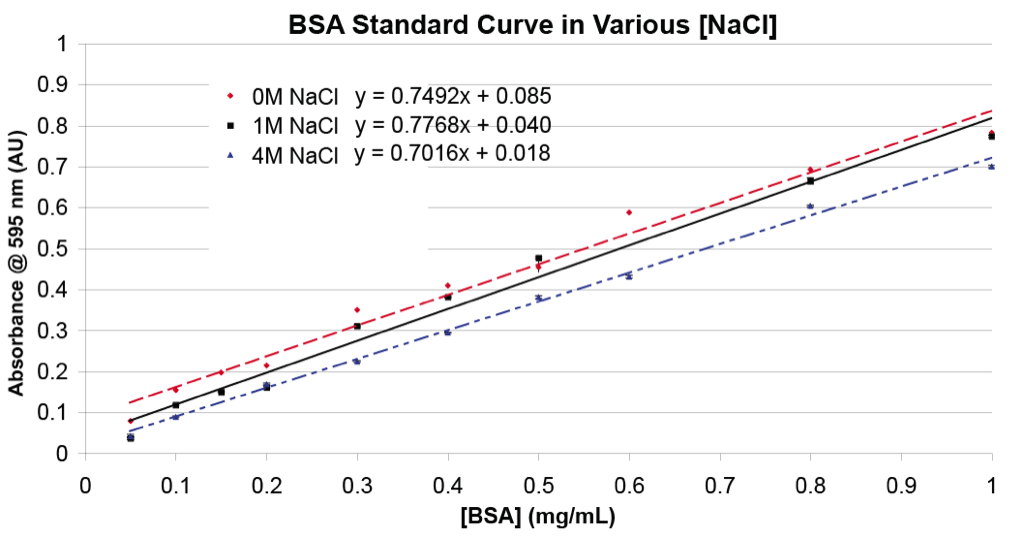
As shown above, the fits for 0M and 1M are very close, with 4M varying slightly. Additionally, the slopes are different between the two graphs for the same concentration of salt. These differences are not that surprising given the finicky nature of the Bradford Assay. Furthermore we do not have to establish a permanent BSA standard curve, as when used in an experiment, Bradford standard curves are created every single time to account for differences in the reagent, solution, spectrophotometer, cuvettes, etc. Do we think they are close enough that I do not have to worry about measuring the concentration of salt in solution being dialyzed to created a BSA standard curve at that specific molarity?
In my opinion, the difference in fits for 0M and 1M NaCl BSA is small enough that, when I dialyze 1 mg/mL BSA in 1M NaCl, I can make a BSA standard curve using 0M NaCl and find the amount of BSA retained with confidence. In the first few dialysis trials I plan on making BSA standard curves using 0M and 1M NaCl to see if there is any real difference.