SepCon Permeability Tests
This is some really preliminary data that I hope to add to in the next couple of days. Yesterday I prepared 4 SepCon samples from wafer 310. I spun them at 3.3 psi for 2 hours with just PBS. I recorded the permeability, and then performed the exact same test with 3mg/mL protein in the same tubes. The permeability was much lower for these samples. All samples were from the outer edge of the wafer (at least x or y position 3 or greater).
Today I took 4 new samples from w310 and spun at 3.3psi for 2 hours with 2mg/mL protein. I recorded the permeability, and did the same experiment without protein using the same tubes. In this case the permeability was identical.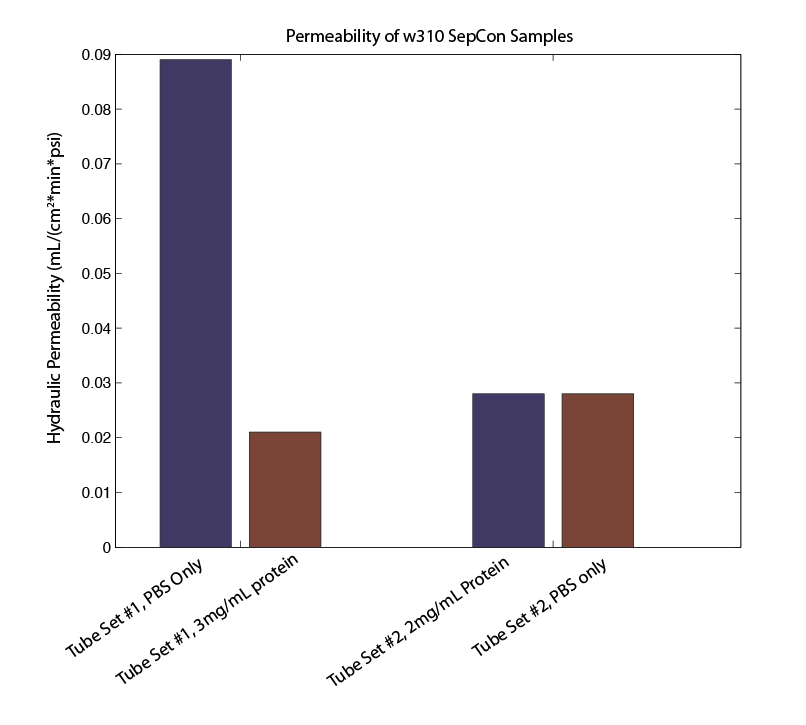 My guess is that protein is clogging the membrane, not that the protein solution is viscous and slows flow. Gels to follow, although the amount that passed is so small I may not be able to detect protein in the reservoir.
Jess –
Where on the wafer were these inserts from? If from the inner wafer, we would expect the permeability to be lower due to the low porosity, right?
What are the units for permeability (it’s not on your chart)?
Also, did you pre-wet the membranes for these experiments? Have we shown consistent flow through membranes that were not pre-wet?
— Dave
– I like the idea of testing for fouling this way.
– I wonder if ‘clogging’ is too strong a word. Since you are getting the same flow after a protein spin, we’ve likely changed the membrane pore size with some adsorption. Something we could verify by TEM. Very cool.
– I’m guessing the units are mls passed per cm2 per psi per min? Mike and I have moved to uls passed per cm2 per psi per min.
I’m also curious about the units. I assume that each bar is an average of 4 numbers? Was the data fairly uniform?
We’ve already shown that BSA will form a skin of what, maybe 5nm on the inner wall of the pores in the Nature paper, so I think the constriction theory is valid. Once adsorbed, it’s not going to go anywhere, unless the buffer conditions change or a surfactant is added. Even then, I have my doubts that it can be removed.
Also, can you give me some idea of how much fluid is passing through the membrane? Is the water height changing enough to affect the pressure? Have we benchmarked the sepcon flow rates in the air-pressure cell to make sure we are really working at 3.3 PSI in the centrifuge? With all the dynamics associated with the EQ format in the current implementation, it would not surprise me if we are quite far from 3.3 PSI. It would be nice to know. Also, can we guarantee that there is no bubble on the backside of the membrane – we would see it, right?
Jim – we can’t do TEM of SepCons and we can’t drive protein through TEM samples, so the best we could do is just soak a TEM sample in the protein solution. But we’ve already done that. Next month the new SEM will hopefully come in, and we will be able to inspect the SepCons in a TEM-like mode.
Chart is updated to show axis units (mL/(cm2*min*psi)).
All samples were from the outer edge of the wafer so that I could theoretically obtain the highest permeability.
The bars are averages of 2 or 3 samples each, since it was inevitable that at least one would break during the spin. I’m working on getting error bars in MatLab, but there was very little variance in the data.
For the highest permeability samples, around 150uL is flowing through. The lower ones are around 50uL. The truth is that once 150uL has flowed through, we are starting to approach equilibrium and significant reduction in driving pressure.
In the current setup I apply a drop to the bottom of the tube so there are no bubbles there. It is possible that bubbles sometimes develop in the well, but I have not noticed these remaining after a spin and the samples that started with small bubbles do not appear to be different than those without.
These results look pretty inline to what was seen before with the 200 series wafers. On that chart – the experiments with protein looked to be around 50 or less uL/min-cm2-psi and that would be 0.05mL. The non-protein experiments topped out at 100uL or 0.10mL/min-cm2-psi
https://trace-bmps.org/NRG/meetings/071127/HydraulicPerm.png