I’ve been gathering data for a paper using my microporous MgF2 nanomembranes so here are some sample figures for such a paper.
Herein, we are trying to create a porous, Raman-compatible substrate for use in cell culture. Researchers have used Raman microspectroscopy to perform quantitative non-invasive measurements of biomolecules in cells. It’s a very exciting technique. While silicon based substrates have excellent properties for cell culture, they have strong Raman background signals and absorb a lot of laser power at the illumination wavelengths we would like to use. MgF2, Quartz, and CaF2 are considered Raman-compatible for their substantially weaker backgrounds. Researchers currently deposit or culture cells on non-permeable coverglasses made of these materials. However, we have known that cells sometimes require a permeable substrate to adopt morphologies that are more consistent with in vivo studies of morphology. So using our microporous nitride substrates, we wish to create a substrate that will have both the permeability and the Raman-compatibility necessary to facilitate more accurate Raman studies of those types of cells.
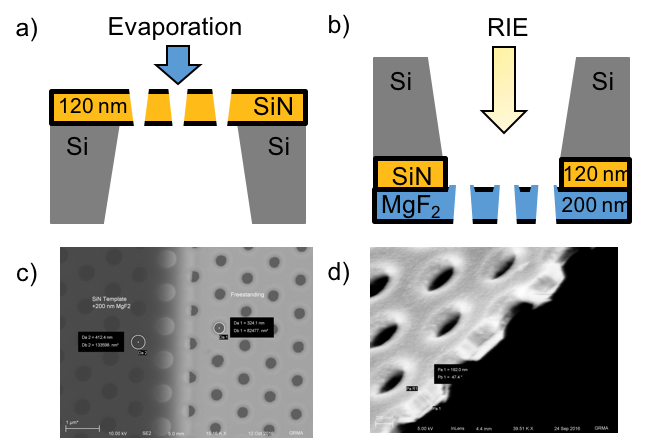
Figure 1. MgF2 nanomembrane material properties. (a)-(b) MgF2 relief pattern transfer, with cartoon crossections of microporous films (not to scale). Beginning with a freestanding film of microporous silicon nitride (a), MgF2 is evaporated onto the substrate (200 nm, 0.1-0.3 nm/sec, 250 °C, Platen Rotation), coating the porous substrate, resulting in a hybrid material. (b) The substrate is then inverted and purified using RIE (90% CHF3, 10% Oxygen, 75 mTorr, 100 W), releasing a freestanding nanoporous film of MgF2. (c) A SEM image normal to the membrane plane shows the infilling effect of the direct evaporation process, as the template pores narrow from their designed 500 nm diameters to approximately 325 nm. (d) SEM crossection of a partially etched MgF2 nanomembrane (with some template backing remaining), showing film thickness close to the targeted 200 nm.
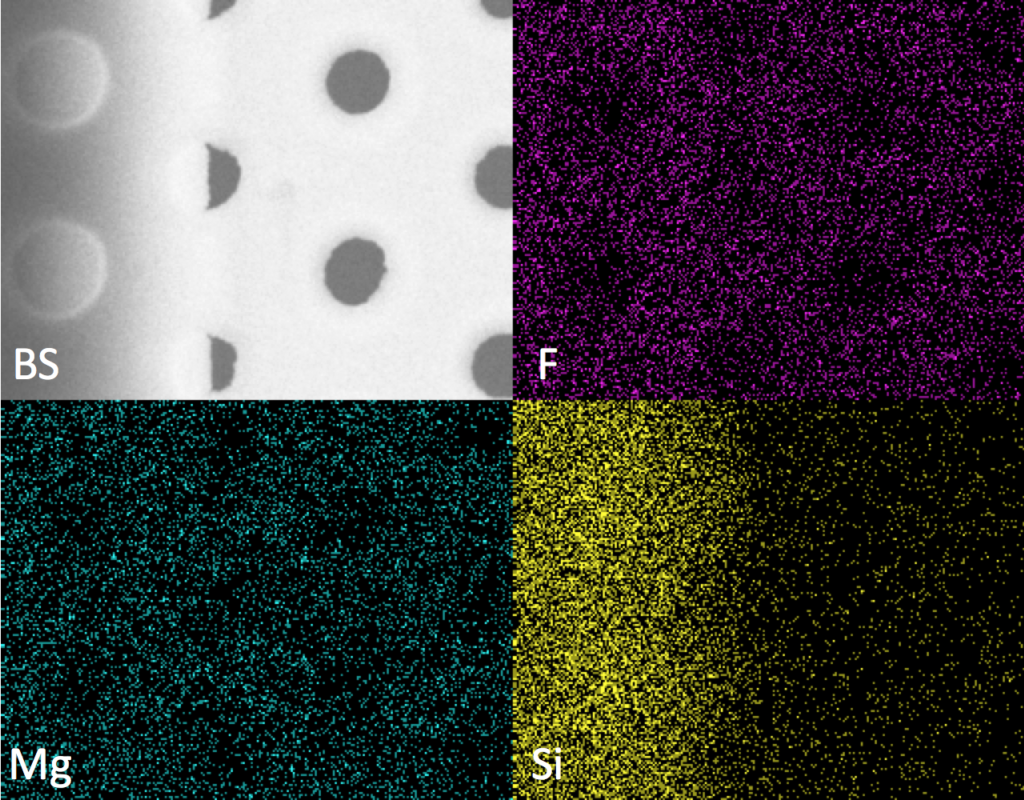
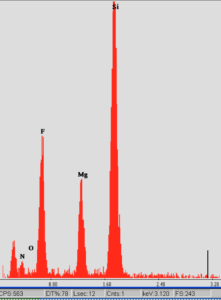
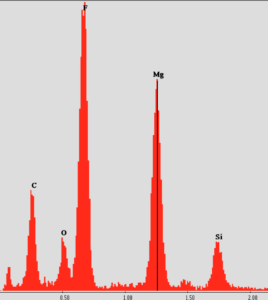
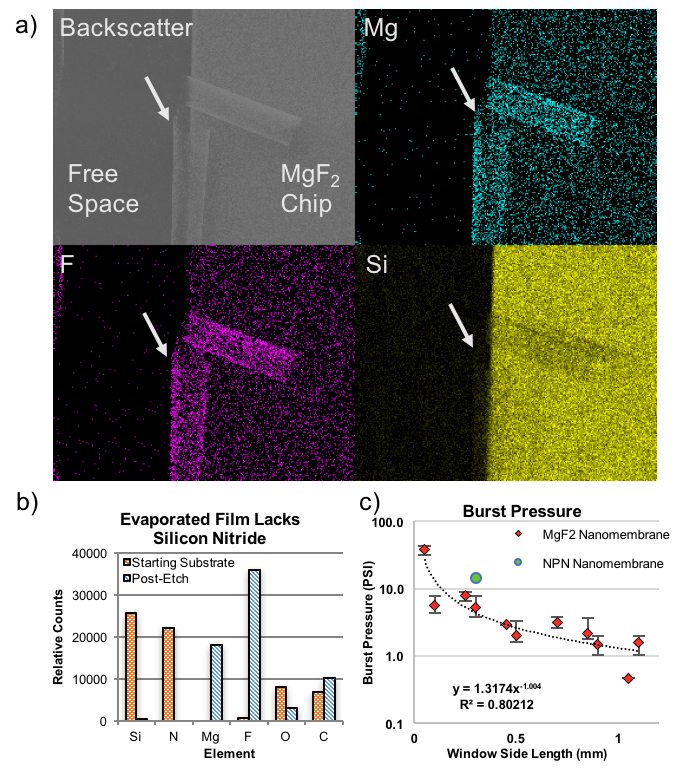
EDS measurement of the composition of the freestanding membrane. While the Mg and F signals are preserved across the freestanding region, the Si signal is not. The membranes are >85% MgF2 in the freestanding region. As a side note, there was some sample drift, so the image is blurred. This is a 30kX image.
Before Etch
After Etch
Previous Figure with 50 nm thick nanoporous MgF2. Here the burst pressure for the 200 nm microporous MgF2 is about 7 PSI, over a 5-slot structure instead of a square window.
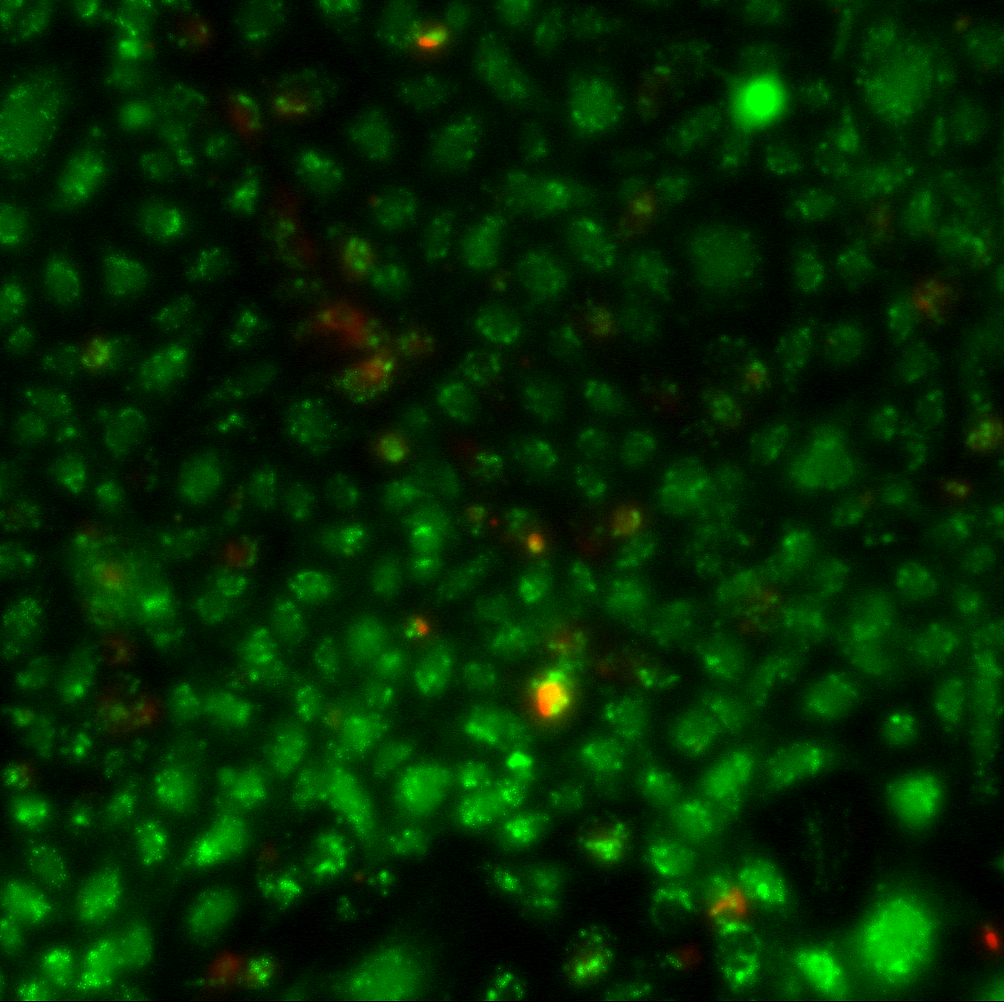
20X Live/Dead stain image of P6 HUVECS (Day 7) on fabricated microporous MgF2 grown in MCDB131 media. Eventually, we will use ARPE-19 Cells with tight junction staining which have a characteristic response to permeable substrates.
We will have to reestabilish the Raman background of the membranes, but the material composition looks to be the same as with my nanoporous material. HUVECS seem to stick ok without using any additional coatings.
This post presents the data from all of my TEER experiments of BBB co-cultures, with bEnd3 endothelial cells on the bottom and NG101815 glia on the top of PET and pnc-Si transwells. For all experiments, I used 50000 cells/cm2 as the seeding density. I always had 3 samples – bEnd3 alone, NG10815 alone and the…
This was something I set up a few days ago and finally got a chance to run the gel. I was curious to try this after the previous forced separations using brain extract. If you recall, the “separation” using the pressure cell did not have a visible cutoff and all of the bands appeared in…
I went through and characterized each wafer by thickness and RTP. I graphed “Average Pore Size vs. Porosity” and “Average Pore Size vs. Cut-Off Pore Size” for each processing condition that had at least four representative wafers. ** Yesterday, Professor McGrath and I had a quick chat about the data. I have inserted a few…
I spent some more time in understanding the numbers I am getting for our device simulations. In my simulations, I am assigning a conductivity value for my cell layer. Technically, from this information and by knowing the thickness and area of the cell layer, I can analytically calculate the value of resistance that the cell…
Here are the results for air permeability testing of W501. The sample closest to the origin had one very small (very difficult to see on Brian’s scope unless viewing at 100x) pinhole, the middle sample had 3 very small pinholes. The completely intact sample had a permeability of .773 cc/(cm^2*atm*s). It seems that the pinholes…
A quick recap: of the pores using the old NPN batch, 2 of them showed folding suppression. The first one I was able to collect events for 1000 and 2000 bp dsDNA, bnoth of which showed almost no folding, but had an unusually low event rate. The second suppressed folding for the first half of…