DNA translocations through ALD-coated NPN
First off, a quick update on the state of the lab. The day finally came, we had to pack up and put everything in storage, so unless there is a very pressing need, I’m done data collection for the time being. I don’t think that will be a problem; we have enough for publication as-is, though we can reassess once I send out an initial draft. I just got internet in my new office this morning after 5 days of arguing with IT.
With that said, I have a small update on the experiments done with the NPN coated with Hafnia. Visually, the Hafnia coating clearly worked. Whereas regular NPN from wafer 1156 has a dull purple color when tented (consistent with thin film diffraction for a 50-nm film reflecting in the near-UV at 200-nm), the coated films have a sky-blue color when transferred to the SiN substrate, indicating a thickness of 100-120 nm. I expected it to be around 100-nm thick after the coating, so it seems to have worked as intended. But we already had a good idea of that from the TEM images I sent over.
Actually getting DNA to go through these things proved very difficult. Of the 8 attempts I made, only two actually gave me good data. The rest either broke curing the tenting step (the coated NPN seems to be a bit more brittle), were too unstable to get any data on before they blew up, or had extreme levels of low-frequency noise and were useless.
The focus of the experiments were on folding distributions, which I plot below. In these plots, the x axis encodes a number between 0 and 0.5. 0 means an unfolded, single-file translocation. 0.5 means a molecule which translocates folded in the middle and is thus completely folded for the entire duration of the event, and the continuum in between is exactly that.
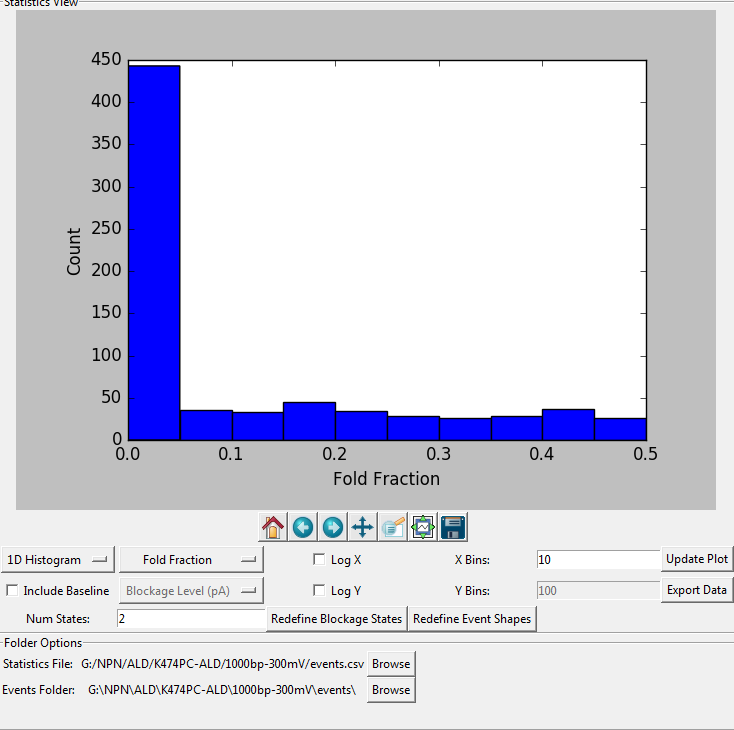
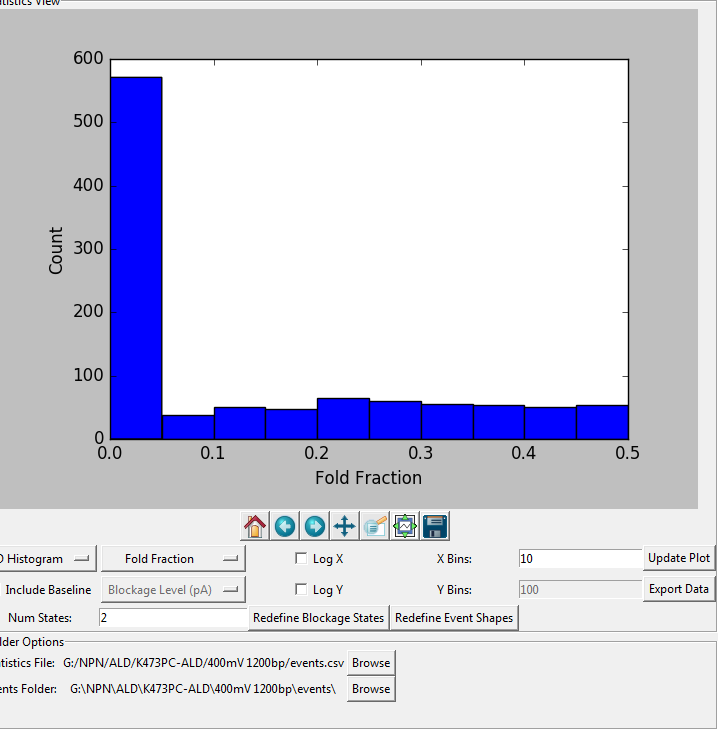
The two images show folding for translocations of 1200-bp and 1000-bp molecules. Both show a preference for unfolded molecules over equilibrium distributions, but neither resulted in complete exclusion of folded events like I saw one time with the regular NPN.
I think this is all consistent with the picture we have of just a few NPN pores feeding the sensing pore, and the local details of the distribution being the deciding factor in the folding behaviour. Not the slam dunk I was hoping for, but enough for interesting discussion.
I’ve started writing a draft of the paper and I should have something rough for Vincent to edit pretty quickly (I’m about 4000 words in already, so it’s going fast – turns out it was mostly written in my head already).
In the near future, I’ll need some figures and numbers from you guys. Let me know if anything on this list is not feasible:
1) a two-panel image, one panel of which is one of the STEM images of wafer 1156 showing the holes, and the second panel of which is a histogram of NPN pore diameters for the same wafer (ideally with a gaussian/other appropriate distribution) fit. Doesn’t have to be pretty yet, I just want to put placeholder images in the draft that contain all of the information that we want to include, and we can pretty them up later.
2) an estimate of the number density of pores for wafer 1156. Assuming a uniform distribution of nanopore locations in 2D, this should just be porosity / average pore area, which I calculate to be about 208 pores / square micron assuming 20% porosity and 35-nm diameter pores. Can you refine this number for me?
3) Could you feed the ALD-pore images I posted in my latest blog through whatever image processing you used to characterize your NPN pore distributions and return to me a pore size histogram?(obviously considering only the ALD-coated pores and not the partial through-holes if possible). Since you have the framework already (I think? Correct me if not) it will be faster if you can do it than if I try to figure it out from scratch while I’m writing. If that’s a difficult task for you anyway let me know and I will work on it on my end. Let me know if you want me to send you originals.
4) If you have a decent schematic of the NPN/nanopore device lying around that we can publish (maybe from a grant application?) send it over and I’ll include it. You don’t want me doing graphic design if there is an alternative.
Regarding the spatial distribution of pores on the NPN, is a uniform random number for the x and y coordinates a reasonable model? Or is there some physical mechanism that restricts the distance between NPN pores that would invalidate that assumption? The reason I ask is because I want to estimate mean and standard deviation of the number of pores in a given (very small) area of NPN as part of the discussion of folding dynamics. I am currently just simulating a random distribution with the appropriate number density and doing simple counting, but I am wondering if the reality might be more complex.
We’re very close! With the lab move things are a bit insane, but I should have a rough draft more or less done by the end of the week.
Yes I will get on these image requests as soon as I can.
Like I said, there’s no real rush. I’ll hopefully be able to send you a draft next week some time so you could actually see how they would be situated in the paper, which might help with setting them up.