Rotation Project – Measuring Transmembrane Resistance and Pressure to Observe Membrane Saturation
Hi all, my name is John Cognetti, and I am a first-year PhD student in BME. I recently finished a rotation in the McGrath Lab. My goal was to measure changes in resistance across the membrane as the membrane becomes saturated with particles. Initially, the plan was to use Tejas’ trans-endothelial electrical resistance (TEER) setup to measure the electrical resistance across the membrane, while flowing particles across the membrane in a way that mimics Kilean’s exosome capture experiments. Ideally this could be used to monitor membrane fouling in real time.
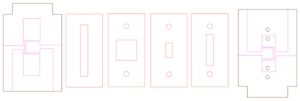
The device setup consists of a bottom electrode (ITO film etched on PET), bottom channel tape (130um), the chip layer (300 um – lot 1255, average pore diameter 36 nm), a sealing layer (300 um), top channel tape (130 um), the top electrode, then the PDMS block (shown below). The electrodes are the same as Tejas’, consisting of a voltage pad (centered over the chip) and a current pad etched into the film.
For capture experiments, I used a similar setup to Kilean’s, with tangential flow above the membrane at 10 µL/min, and 2 µL/min withdrawal below, with the bottom inlet sealed off. Initially, I tried running gold nanoparticles (40nm) across the chip just to see if the membrane could capture them. However, in the salt solution required to do electrical measurements (e.g. PBS), the AuNPs tend to aggregate. I switched to a solution of polystyrene beads (50nm) diluted 1:10K in 1X PBS.

The electrical measurements showed an increase in resistance over time, which eventually leveled off as the membrane became saturated. However, the sensitivity was not great as the change in resistance was only about 10% (about 50 ohms for a baseline of 515). I ran it again with a new device, and the change in resistance was about 200 ohms, but the baseline was much higher this time, about 1550 ohms (baseline resistance can be very sensitive to initial conditions).
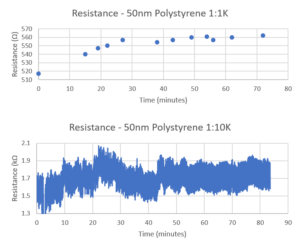
The maximum resistance of the membranes will remain finite because any pores being open allows for easy transport of ions. Thus, if the membrane reaches a state of equilibrium with most of the pores covered, but just a few open, the resistance will plateau since ions are still able to pass the remaining open pores fairly easily. This makes it difficult to use resistance as a sensitive measure of membrane fouling.
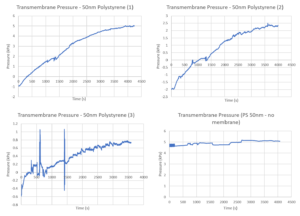
Accordingly, I switched to pressure sensors. The device is simpler for this, using Kilean’s clamped system. It consists of a coverslip, bottom channel, sealing layer, chip, top channel, and PDMS. As the membrane becomes saturated with particles, the transmembrane pressure should increase as less PBS is able to cross the membrane. Because the top channel has an outlet, but the bottom channel inlet is sealed, with a pump withdrawing from the outlet, this results in a large decrease in pressure below the membrane, while the top channel pressure remains roughly constant. The graphs below just indicate the difference in pressure between the two sensors, on three different chips, and a graph of polystyrene beads crossing the sensors (without a membrane) to show that this is an effect specific to the membrane.
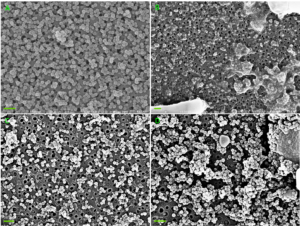
One issue with these tests was the formation of cakes of the polystyrene particles. Initially I ran the particles diluted at 1:1K, but that showed the entire membrane covered in particles. I lowered the concentration to 1:10K, but still got some caking on the membranes. These large particle aggregates actually shield the pores from particles flowing across the membrane, which results in more flow through it. So lowering the concentration should actually result in greater capture, and a more dramatic change in pressure. Below are SEM images of the three membranes from the above experiments. The first is from the initial TEER experiment (1:1K dilution).
In the future, the concentration of the polystyrene beads needs to be at a level where cakes aren’t forming on the membranes. If an ideal concentration is found, it might allow for resistance measurements to be used again, since more pores will actually be filled, resulting in a more pronounced change in transmembrane resistance. But given the simplicity of the pressure system, it might be best to stick with the pressure sensors. In that case, gold nanoparticles in water (as opposed to polystyrene in PBS) might be better, since 40 nm AuNPs would better fit the pores in the chips used from Lot 1255 (average pore diameter of 36 nm).
In conclusion, this project was able to show that membrane fouling is measurable in real time with pressure sensors. This could be very useful in capture experiments such as Kilean’s exosome isolation work, to determine the rate of capture and possibly the absolute number of particles captured as they flow across the membrane.
Edit: I did a comparison of the number of polystyrene beads to the number of pores to see why we were getting so much caking of the beads on the membrane. The beads come at a concentration of about 1.5 x 10^14, so since I was diluting them to 1:10K, I had a concentration of about 1.5 x 10^10 particles per mL (each experiment used approximately 1 mL). The number of pores on the chips I used (10% porosity, average pore diameter of ~40 nm) is about 1-3 x 10^8. So their were about a hundred times as many beads as pores. When you account for the fact that many of the beads (about 1/3) will never come into contact with the membrane, there’s still a large discrepancy there. Reducing the beads to a dilution of 1:100K or 1:1M should give better results when trying to observe membrane fouling.