Adsorption Quantification III
UPDATE: Teflon data now include
Original Post:
Refer back to Part I, and Part II
This weekend I ran a bunch of gels to flesh out the adsorption data a bit more. I tested MicroCons, NanoSeps, and teflon and reran the initial Pnc-Si gel to get rid of negative results due to uneven staining. To test the MicroCons and NanoSeps, I pipetted 1mg/mL BSA on the top of 30kD cutoff samples and allowed it to adsorb for 30 min. I then extricated the membranes from their plastic housings and washed both the membranes and housings. I applied 1x sample buffer to both the membranes and housings and left it for 30 min. I then removed the sample buffer and ran the gels.
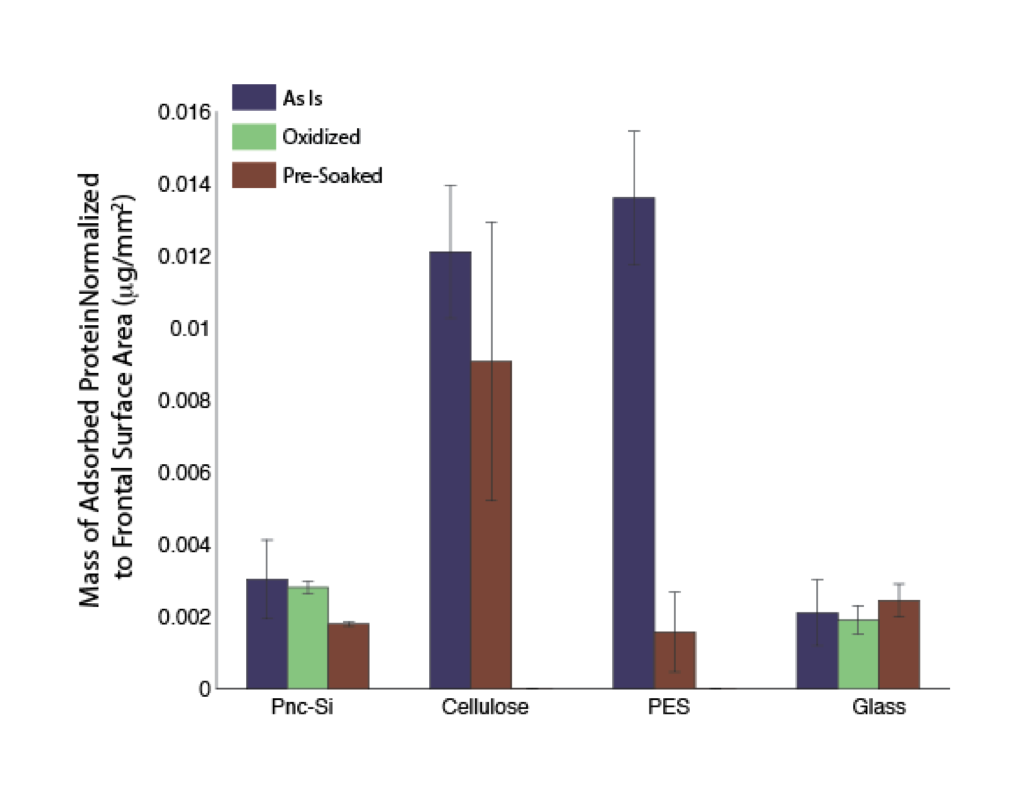
In this first figure I simply show the updated chart from Part II with the better stained pnc-Si results. The bar no longer has negative results but has shifted a little higher. These are the exact same samples as before.
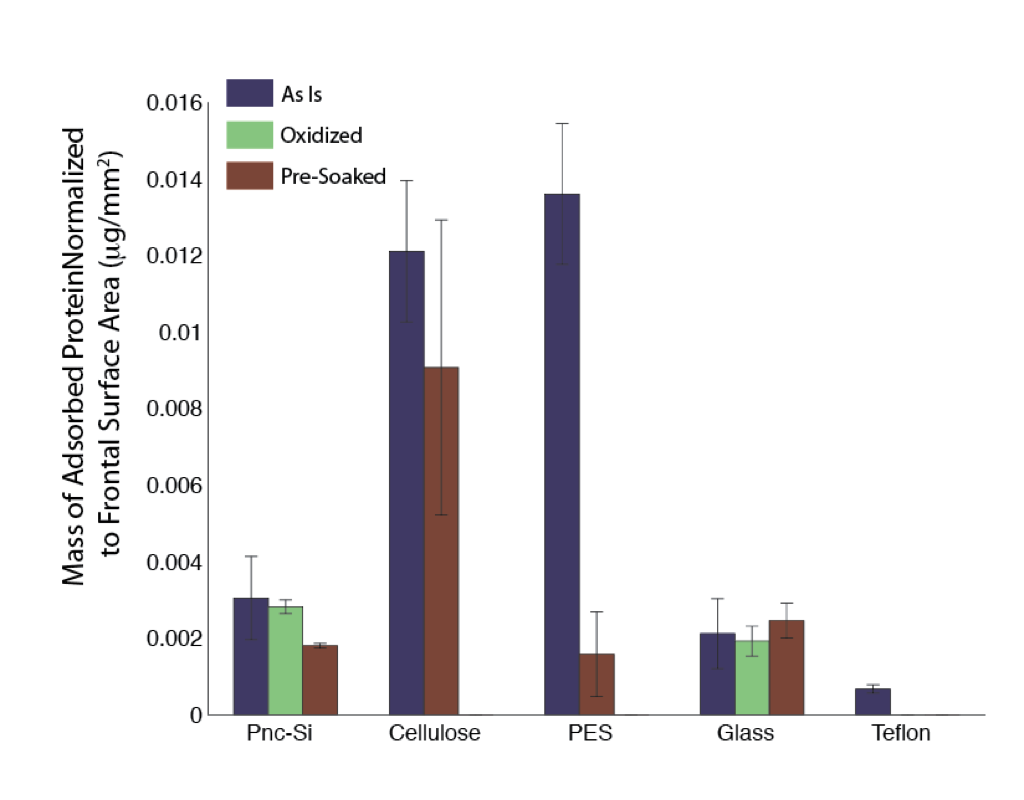
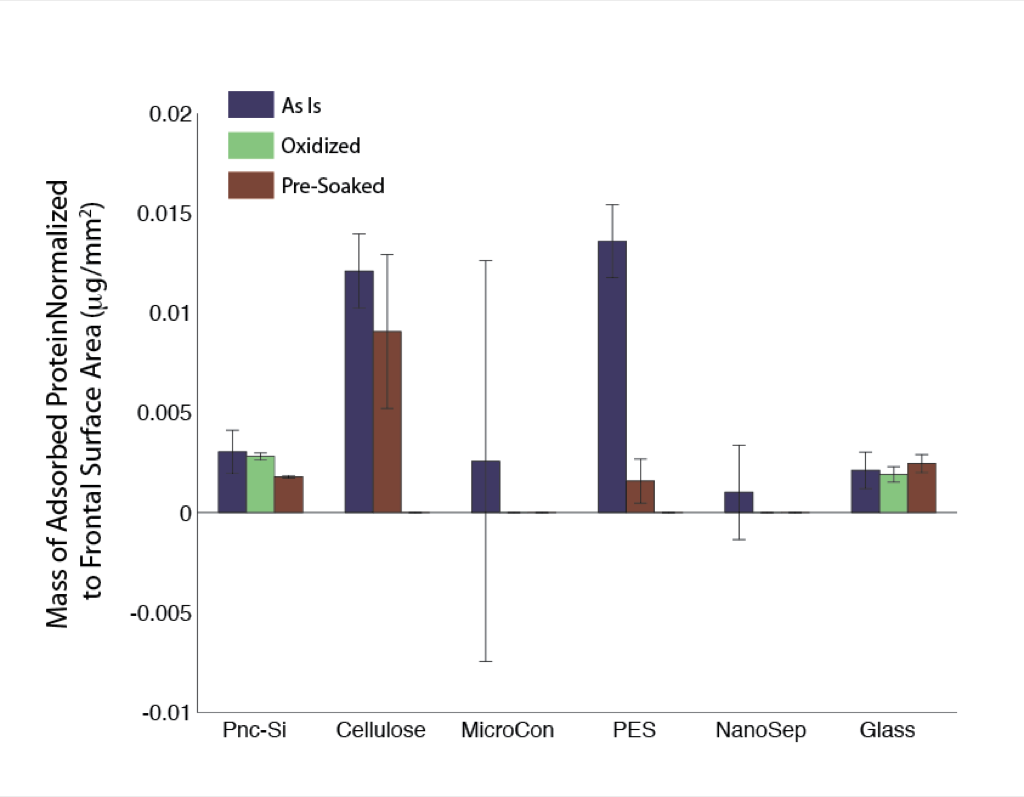
In the second figure I’ve added the quantified MicroCon and NanoSep data. It looks horrible with lots of error and negative error. I’m not sure what the problem is but I will try rerunning these samples. I ran gels for the plastic housing (protein does stick) but haven’t yet quantified them. The teflon data is not shown as there was a major error with the staining of the mass standards, but it looks like this material has the lowest protein binding so far.
I’m a little concerned on the reproducibility of these results. The big errors and slight shift in the pnc-Si data might be a product of the “flakiness” of silver staining. There sometimes seems to be weird backgrounds or anomalous staining.