Rhodamine Dilution Graph
I re-ran the rhodamine dilutions narrowing in on the molarities within the range readable by the spectrometer. My start sample was .5mM of Rhodamine. The wavelength I set the spectrometer at was 530nm with 3 trials of each dilution. I started with the least concentrated dilution and cleaned the cuvette between every trial so as to eliminate as much contamination as possible. For the graph I averaged the absorbency for each dilution and plotted the concentrations on the graph below. The R^2 value is much better this time, .9932. The standard deviation was between .0005 and .001.
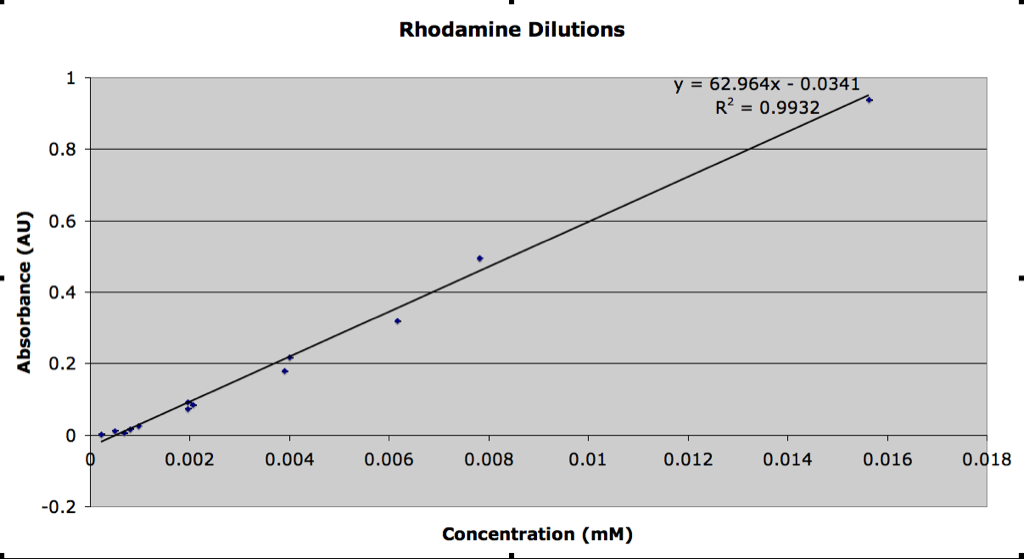
Much better! Based on your data, what do you think the realistic detection range of the spectrometer is for rhodamine?
The detection range of the spectrometer for rhodamine is between .2 uM – .02 mM