Gold Spectra
This is a follow-up to my last post about gold separations. Using the Tecan, I’ve scanned the absorbance spectrum of all the gold particles we posses in water, 10 mM KCl, and 100 mM KCl. Here are the results:
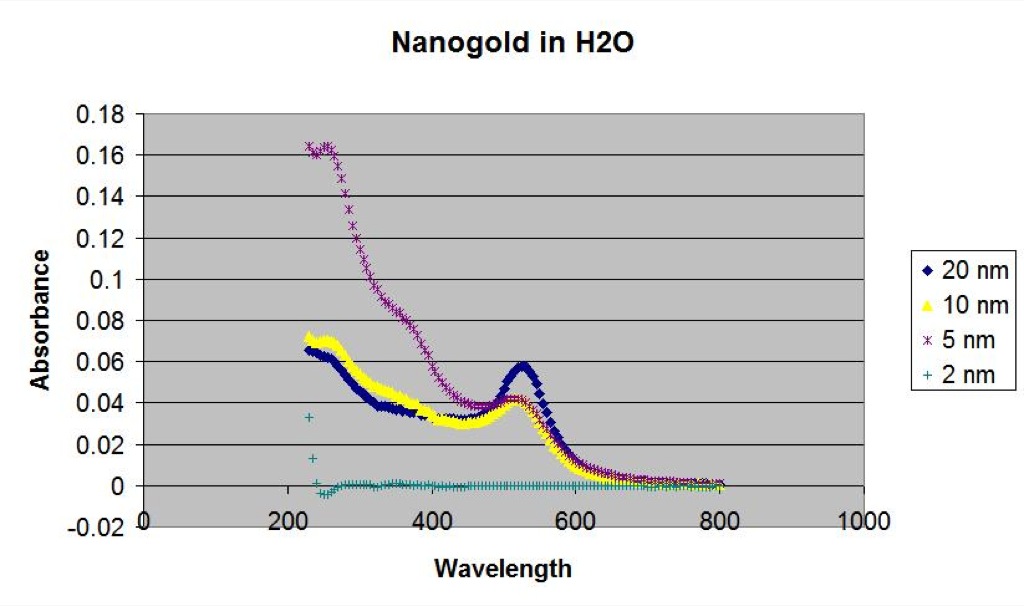
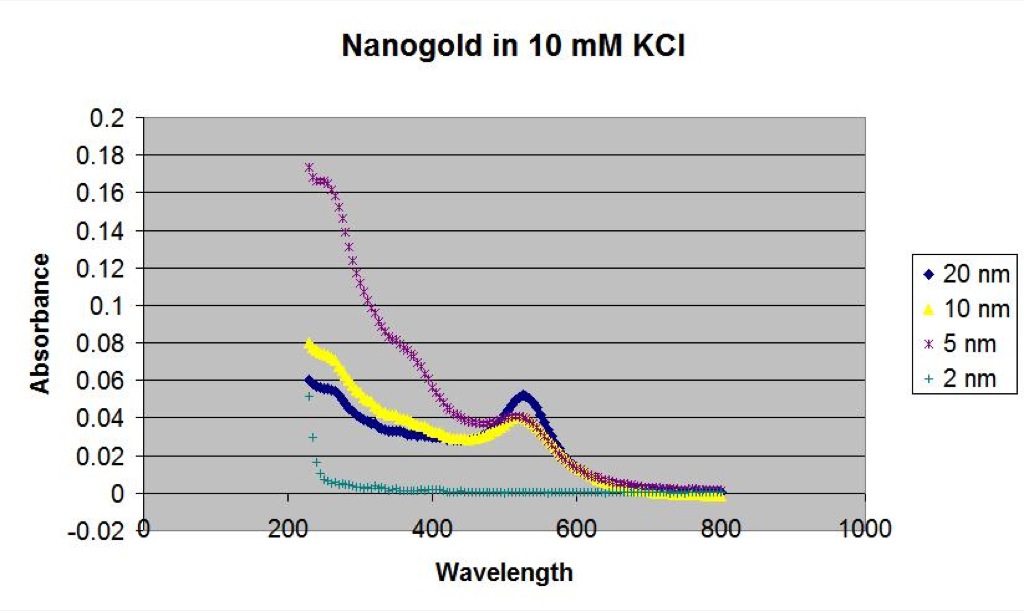
The internal peaks are between 515 and 525 nm and are the same for both water and 10 mM KCl. 10 mM KCl still means a ~3nm Debye length for our membrane.
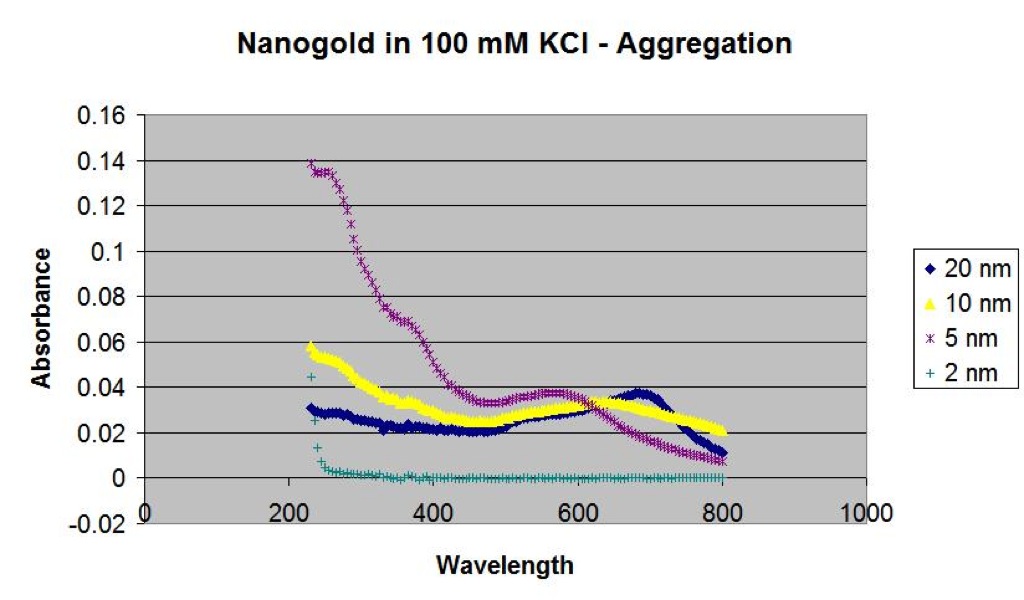
The gold is aggregating in the 100 mM KCl, which can be seen from a shift in color from red to purple. The 5 nm gold is not quite as affected as the larger sizes, but it is also aggregating by eye over time.
Next I looked at a dilution series for 5nm gold. I started with the stock and diluted in half until I could no longer see the spectrum. I don’t notice any aggregation, but the height of the peaks drop.
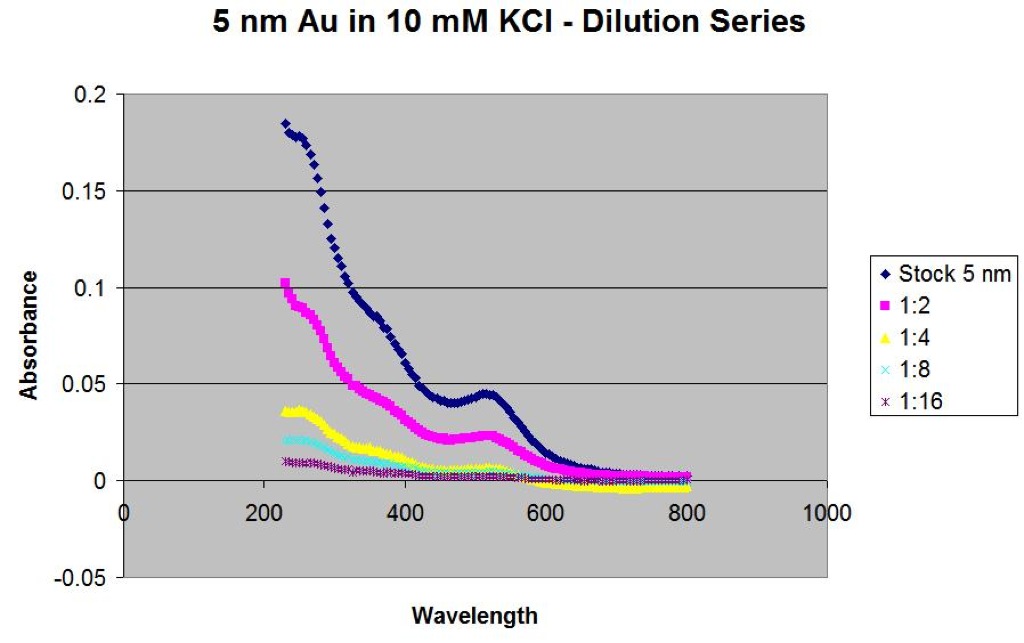
If we compare this to my previous study, the filtrate could fall between 1:8 and 1:16 dilution. While this isn’t that sensitive, it seems to work better than the zetasizer because of the larger particles exuded (?) by the ertylite.
Zetasizer data for particles:
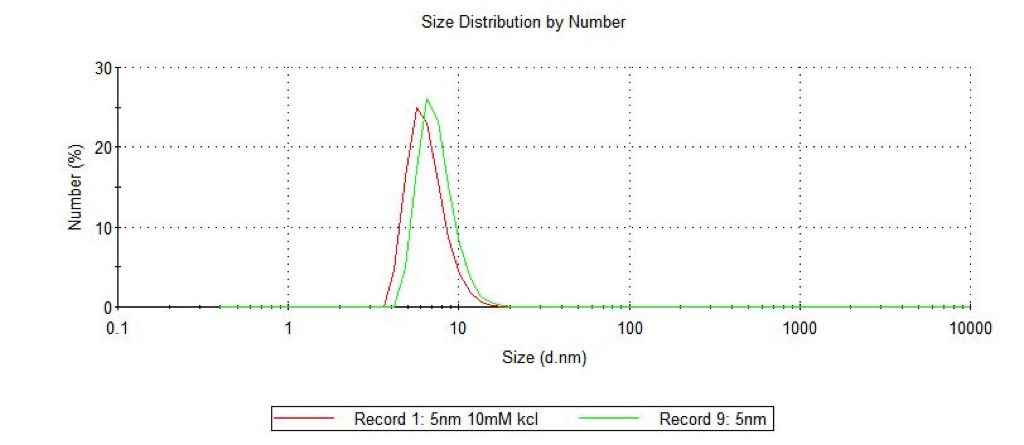
5nm gold reads at ~6.5 nm by DLS. No significant shift in 10mM KCl (within the error).

10nm gold reads ~7.8 nm by DLS. No significant shift in 10mM KCl.
We should confirm the lack of aggregation in 10 mM KCl with the zeta sizer.