Burst Pressure
In my last post we determined that there is an inverse relationship between porosity and burst pressure. I continued to dig further into other factors that affect the burst pressure of the membrane. Pure silicon was used in all the measurements. I measured the burst pressure of many samples that differed in properties that includes film thickness, geometry (slot versus window), and window size (or minimum dimension length).
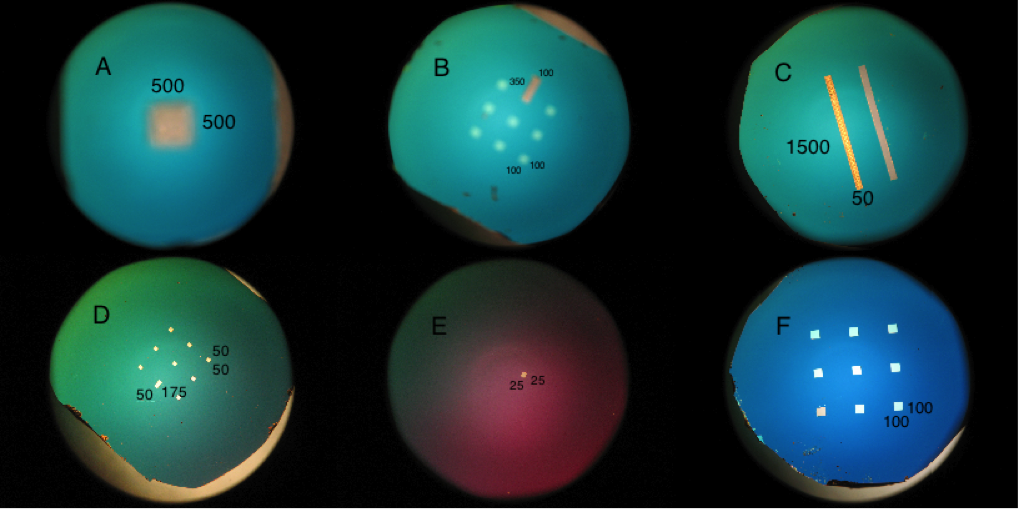
Image 1: Images of the different geometries used. Different thicknesses were used in addition to the different shapes and sizes
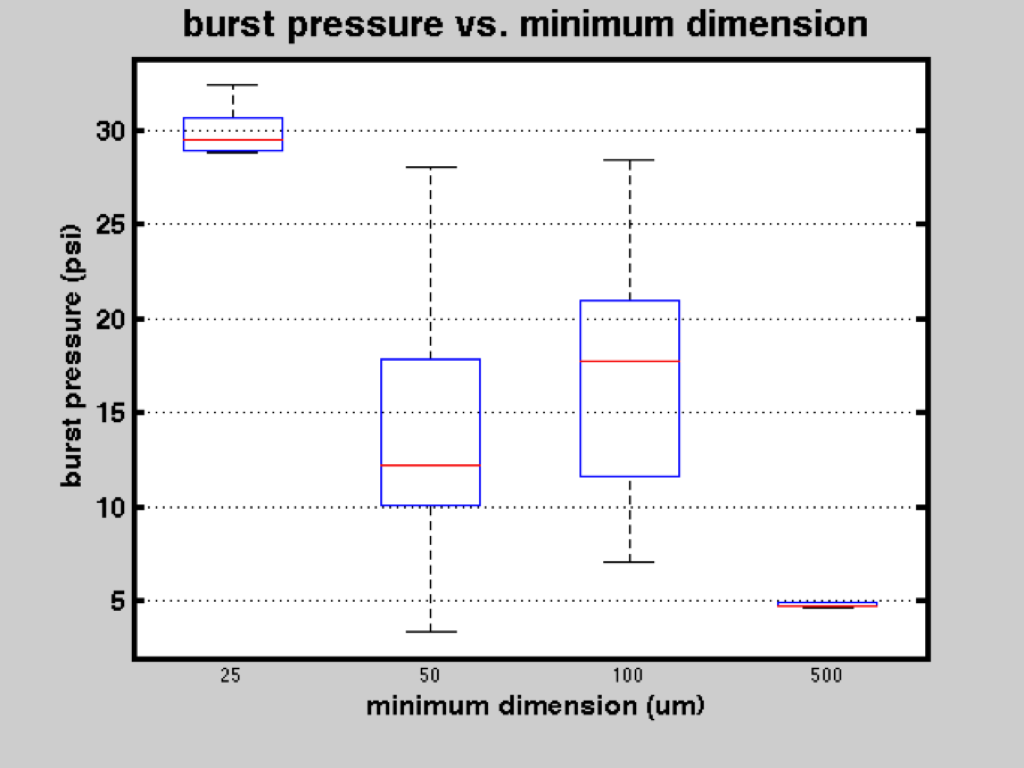
Figure 1: Boxplot of burst pressure values grouped by their minimum dimension
Figure 1 shows that as the minimum length gets larger, the strength of the membrane decreases. The 50 um minimum dimension group includes two different types of geometries, a 50x50um window and the 50x1500um slot.So I broke that group into 2 more groups with different lengths (50 versus 1500) to test if the length of the membrane affected its strength.
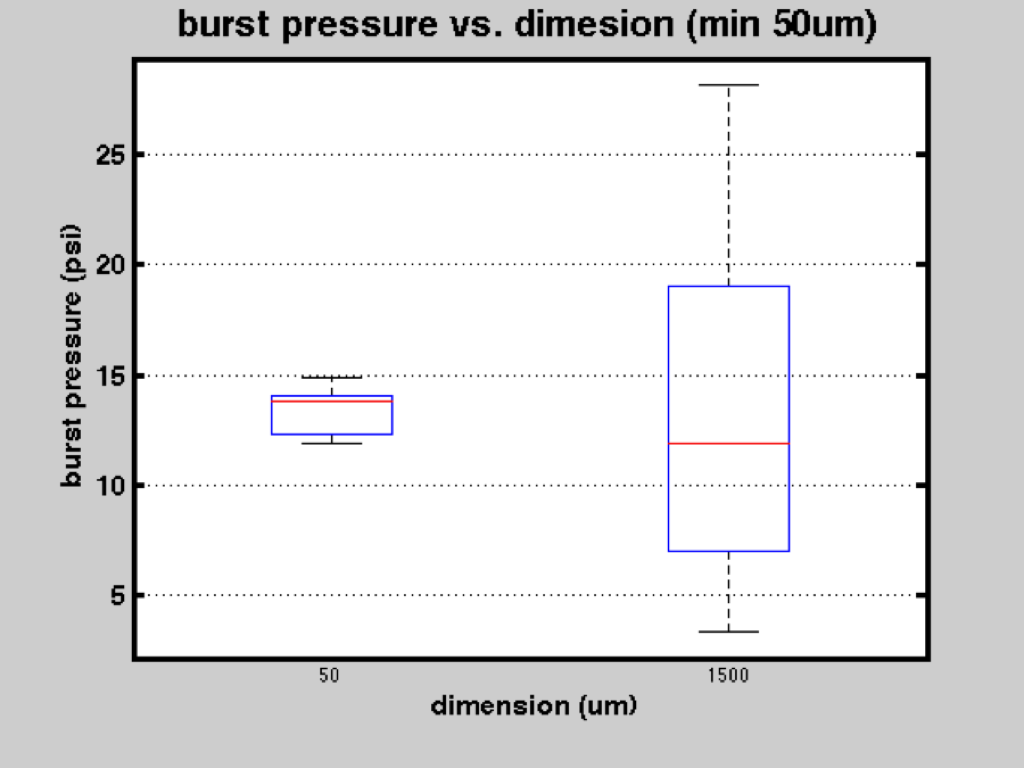
Figure 2: Burst pressure values of membranes with min dimension of 50um and different lengths
I ran an ANOVA test to see if the 2 were significantly different. I got a very high probability, 0.9527 which means the two groups are not significantly different. Therefore, we can conclude that the length of the membrane does not affect the strength of the membrane. However, that fact may only hold for a minimum dimension of 50 um. Some my square windows came on a 3×3 grid (9 total membranes) where one of the membranes was a 100x350um rectangle, which can be seen at the top of the post in Image 1 labeled B. As I did my measurements I examined which membrane broke. The rectangular membrane broke first in 87% of my samples indicating that the length contributes to the strength. So there might be a complex relationship between the minimum dimension and the length.
Next I took the just took the 50x1500um slot membranes and divided them into groups based on their thicknesses.
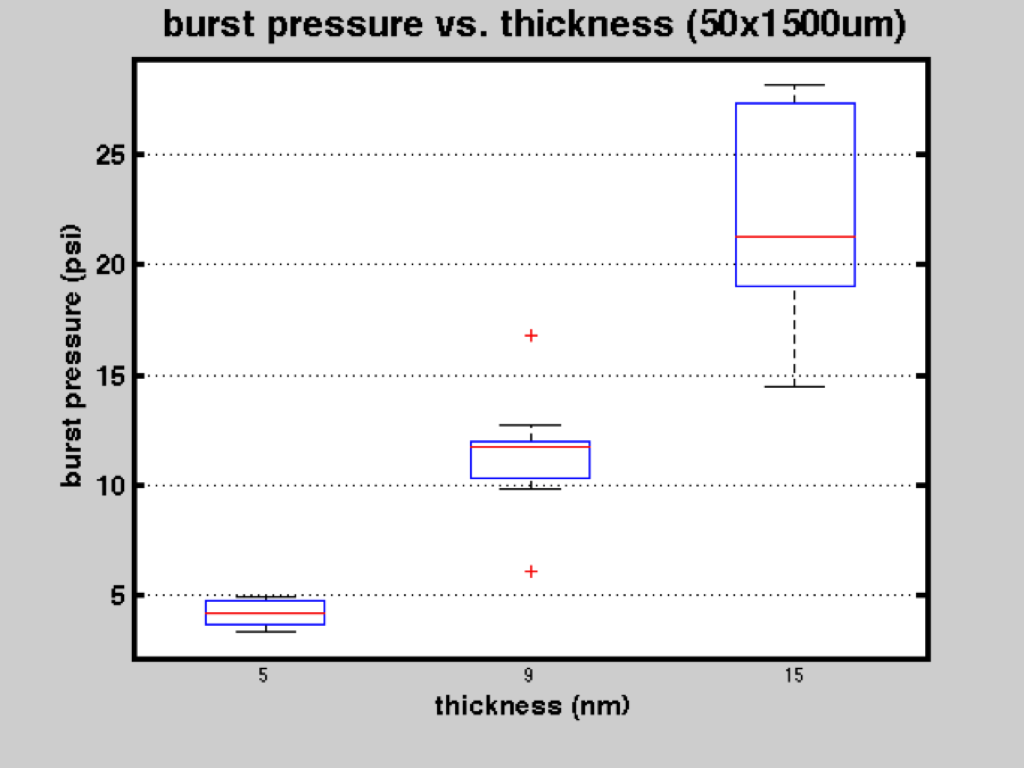
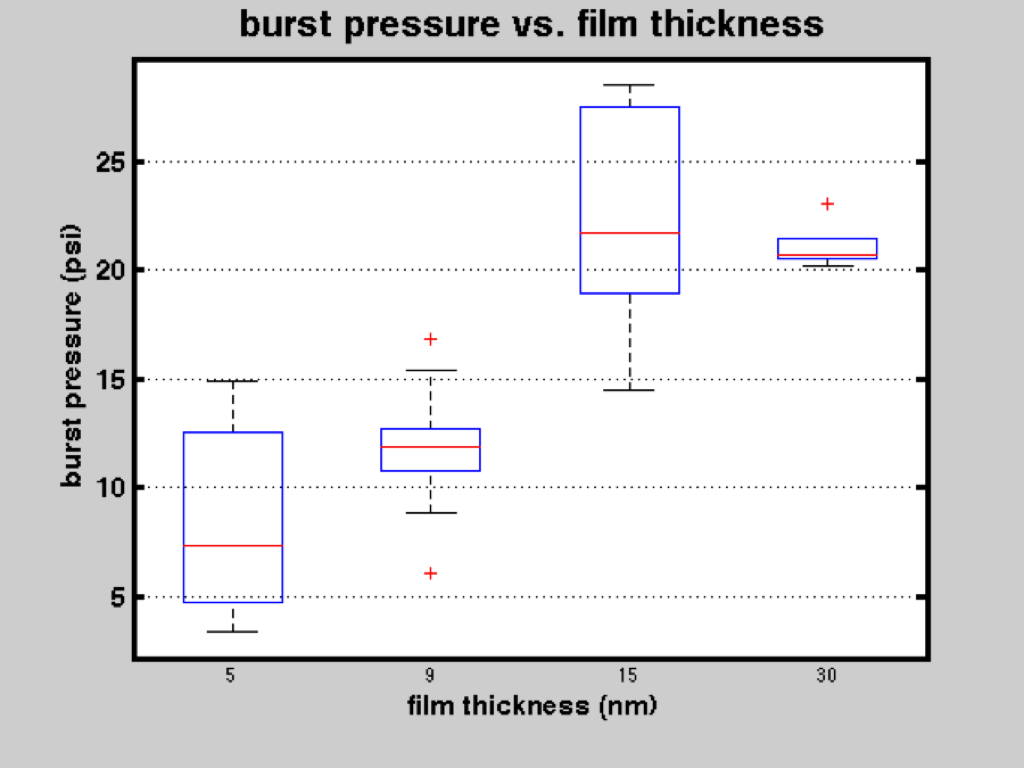
Figure 3: Burst pressure values of slot membranes grouped according to their thickness
Figure 3 shows that the burst pressure values increase as the film thickness increases. I ran another ANOVA test just to be certain they are all significantly different from each other. The test gave me a very small p-value, 3.46571e-08. However, all that means is that at least one group is significantly different. I had to use a post-hoc analysis to do multiple comparisons (MATLAB command multcompare). This sets up comparison intervals for each group. If any of the intervals overlap with each other, then they are not significantly different. If they do not overlap, they are significantly different. MATLAB does a good job of displaying this in a figure. Notice that the axes flipped.
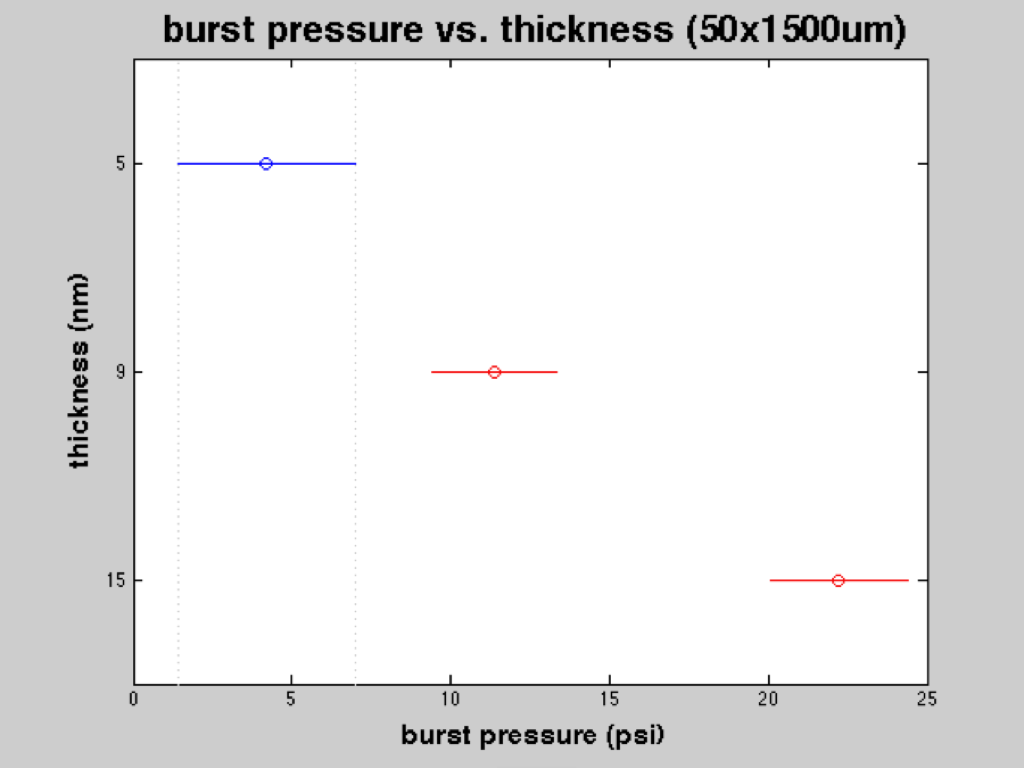
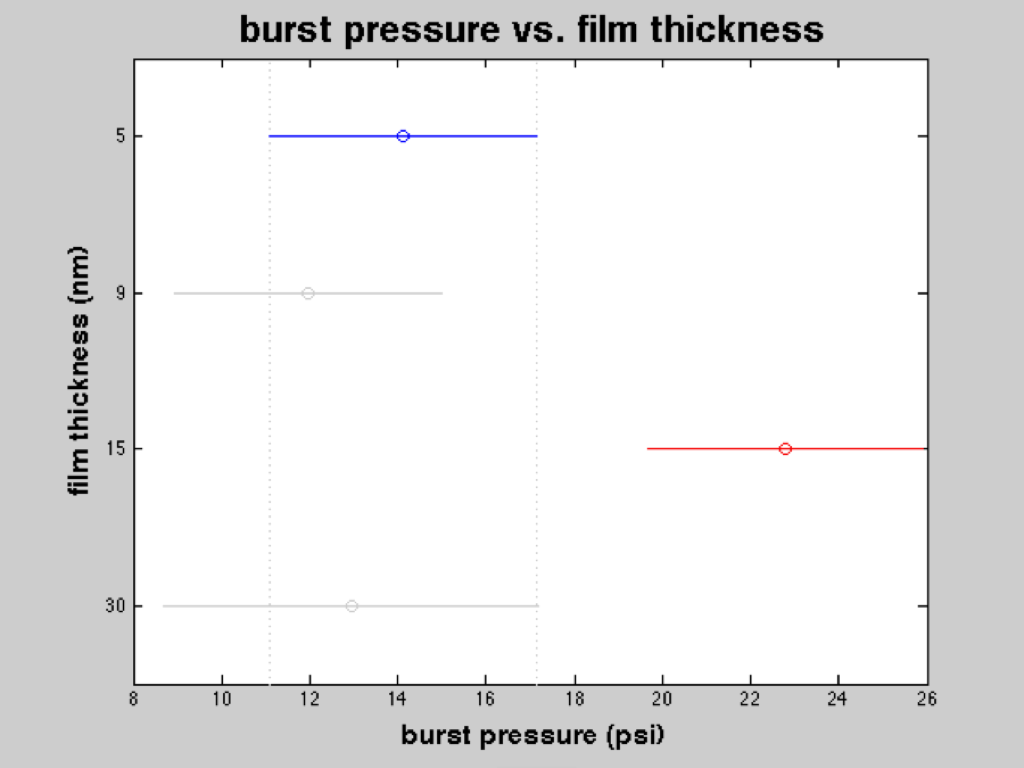
Figure 4: Post-Hoc analysis of slot burst pressure values versus film thickness
Figure 4 shows that none of the intervals overlap, concluding that the groups are significantly different. Here is the burst pressure values for all the data versus thickness.
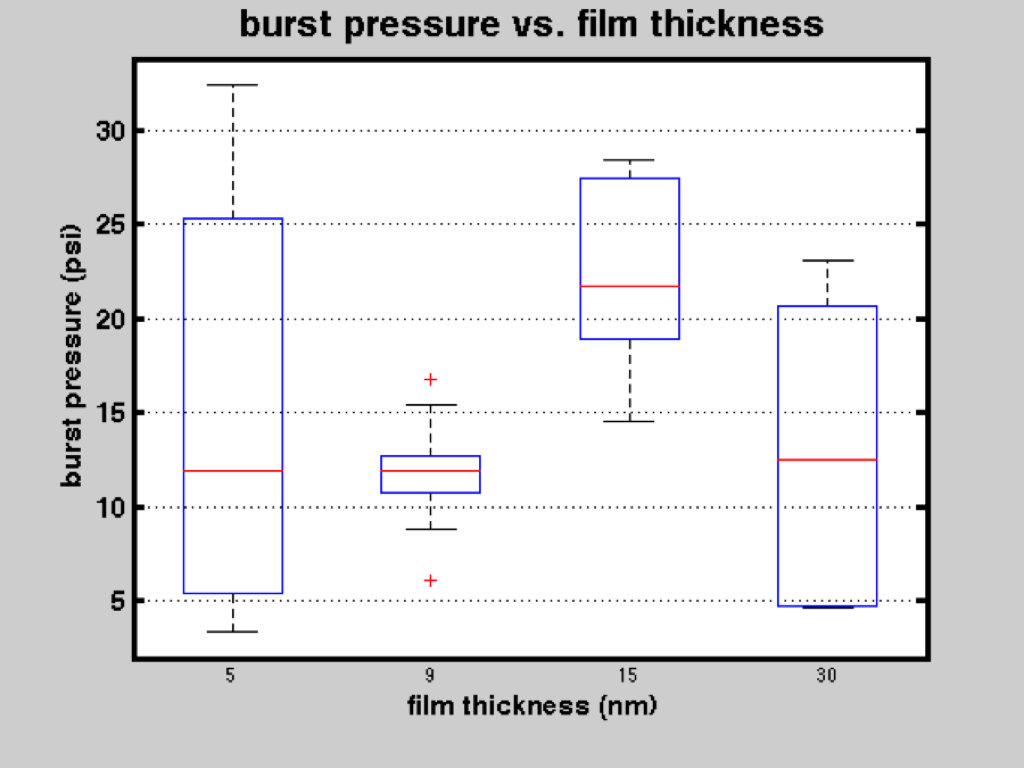
Figure 5: Burst pressure values of all membranes grouped according to their thickness
Figure 5 seems to show that thickness has no affect on burst pressure and according to the ANOVA/post-hoc analysis, only the 15nm thick samples are significantly different. However, I think I had a couple of extreme cases that threw off this data a little. Panel A in Image 1 shows a 500x500um window with a thickness of 30nm. Even though this membrane was really thick, the samples had really low burst pressures. Panel E shows a 25x25um window with a thickness of 5nm. These samples had very high burst pressures. With those samples removed, the boxplots looks more like the relationship in Figure 3 and the ANOVA/post-hoc shows that most of the groups are different.
The next figure includes all the data and looks at area.
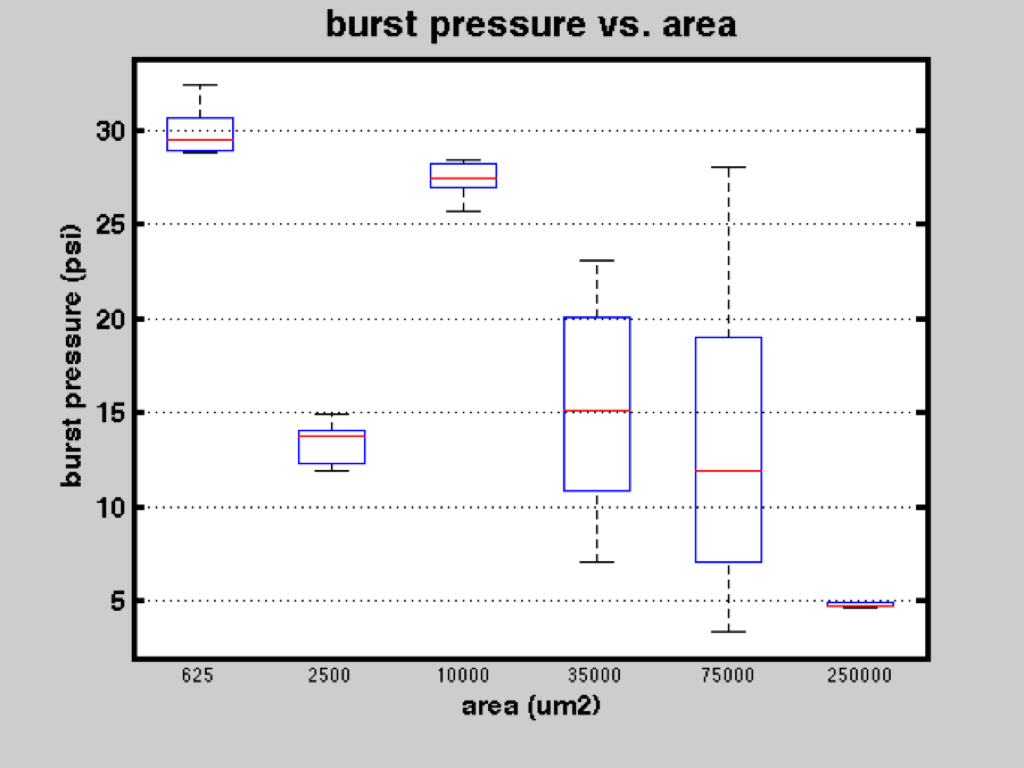
Figure 6: Burst pressure values of all membranes grouped according to their area
Figure 6 shows a genreal trend that as the area gets larger, the burst pressure gets smaller. An ANOVA test and post-hoc analysis show that there is significant diferences between some of the values.
The next factor I took a look at was frame thickness. There were 2 different frame thicknesses, 100um and 200um.
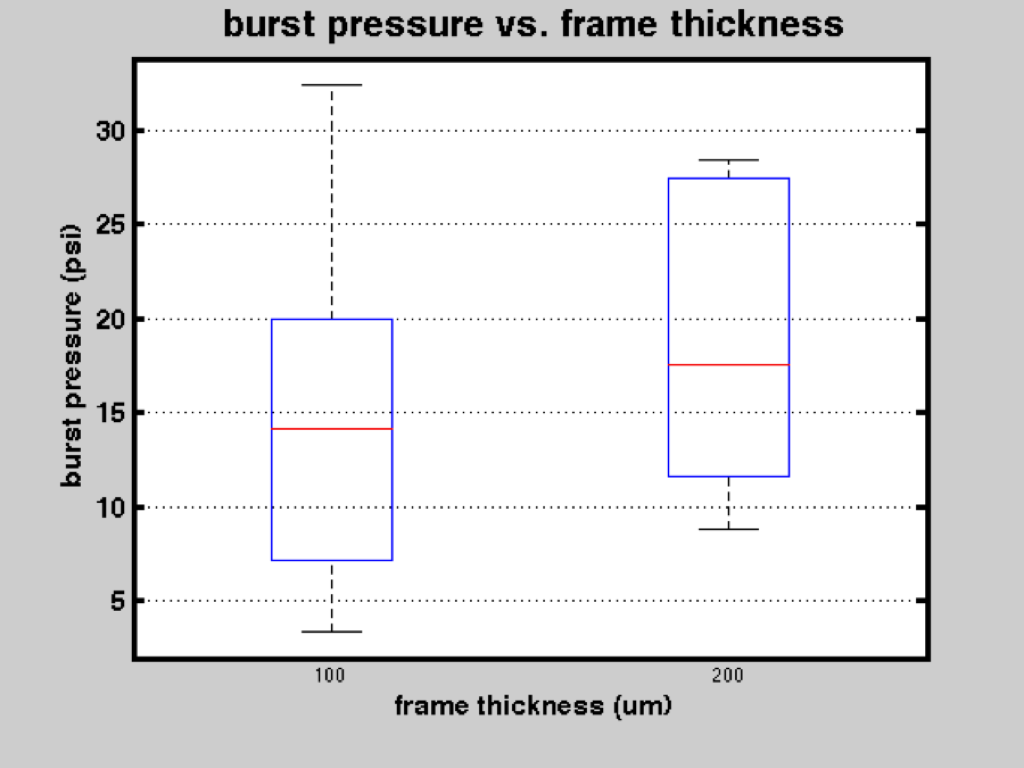
Figure 7: Burst pressure values of all membranes grouped according to their frame thickness
Figure 7 shows that the median values for the 2 different groups are pretty similar. However, an ANOVA test gives us a pretty small p-value of 0.0359. Therefore, the two groups are significantly different and that this indicates that frame thickness affects burst pressure.
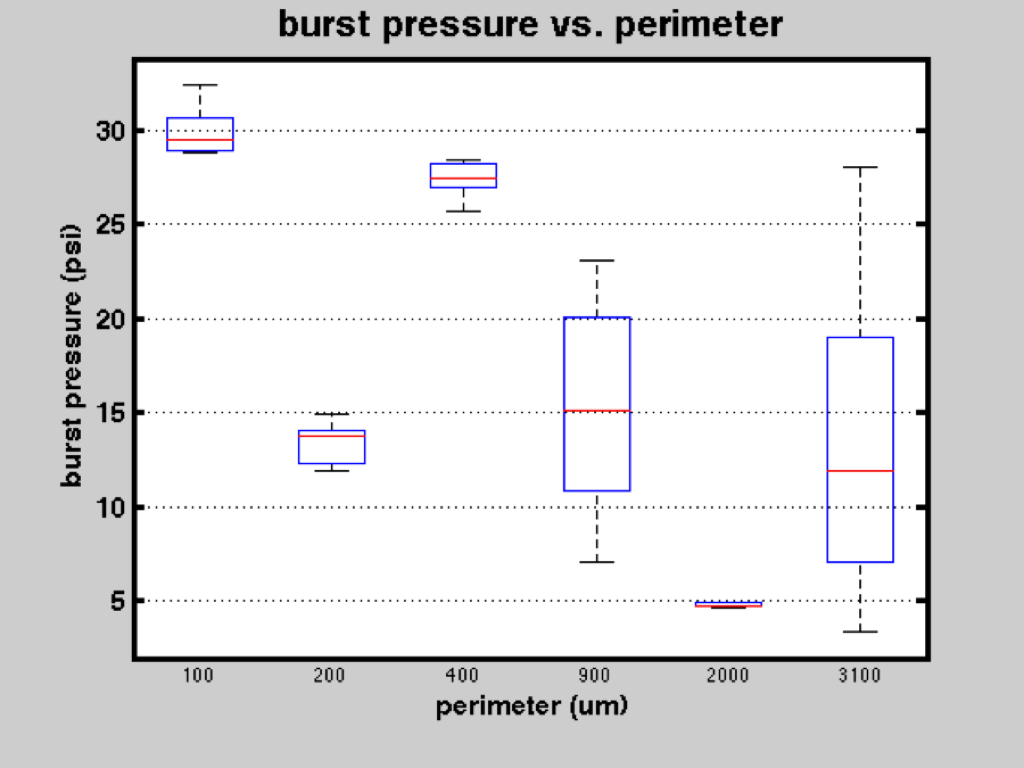
I also looked at the perimeter and found that it values a trend very similar to the area in Figure 6. The ANOVA/post-hoc analysis also shows that there is differences in the groups. The last factor I looked at was the overall geometry itself. I compared the window samples versus the slot samples.
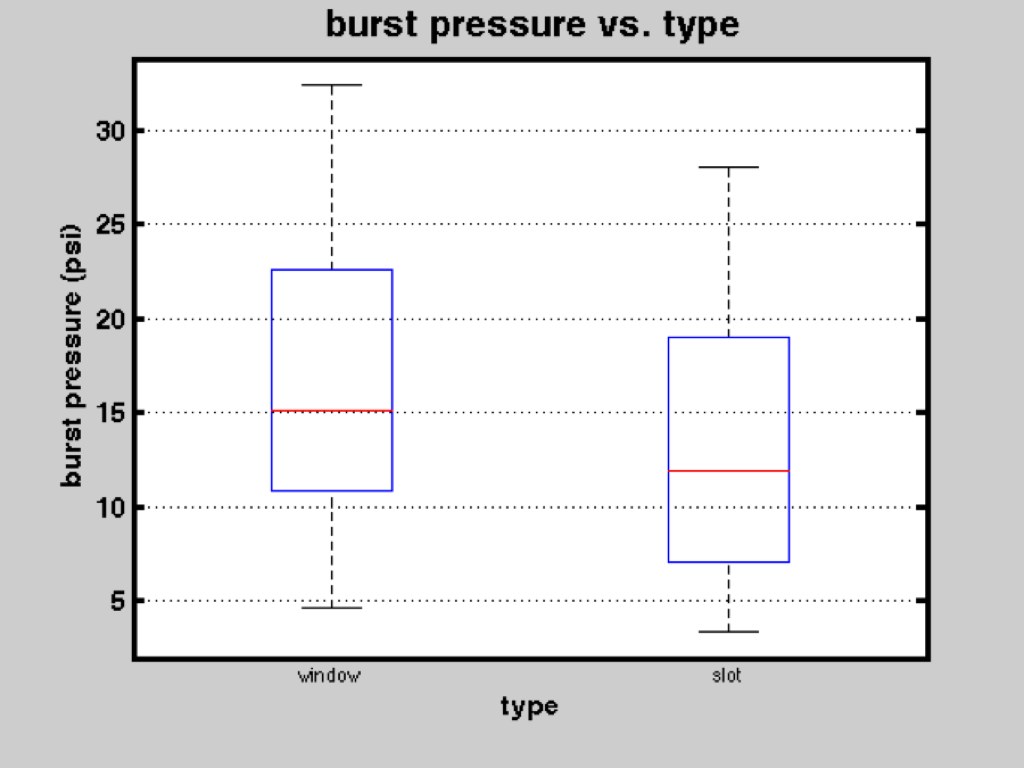
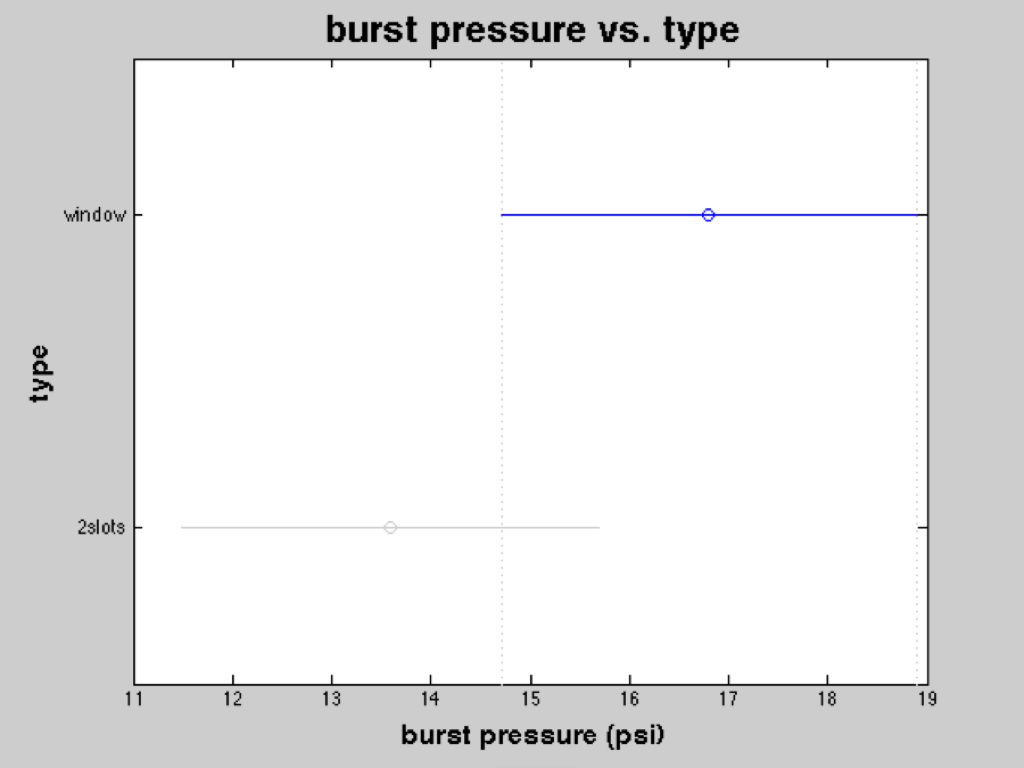
Figure 8: Burst pressure values of all membranes grouped according to their type
Figure 8 and the post-hoc analysis show that the groups are not significantly different.