Stable, Reasonable, and Reproducible Zetapotential Readings for pnc-Si Remain Just Out of Reach
I’ve spent a long time in lab trying to optimize the protocol for streaming potential measurements. The slope of an applied pressure vs. streaming potential graph can give us the apparent zetapotential through the helmholtz-smolachowski equation. The apparent zetapotential is a good measure of the surface charge of a nanoporous membrane, and since I’ll be attempting to metallize and dynamically modulate the surface charge of membranes, as well as characterizing how native surface charge affects sieving behavior, it is absolutely crucial to the idea that someday I will graduate that I can accurately and precisely measure zetapotentials across different chips, and it would make my life much, much easier if I could measure the same zetapotential on the same chip multiple times.
As it stands, I found that I was able to get remarkably precise values for SiN wafer 1015 (Zeta = -22.4 mV; n = 5) and pnc-Si wafer 1038 (Zeta = -17.9mV; n = 3) from chip to chip, but that the act of measuring the zetapotentials was destructive (i.e. upon re-measuring the zetapotential would drift towards 0). In particular, I found that the hydraulic permeability seemed to decrease over time (although in the current setup I have no way to measure this) and that at pressures higher than 2 psi the streaming potential slope would deviate from linearity and begin to curve upwards. When I re-filtered my solution and was extremely careful about sources of crud in the water, I was able to get one chip that had a consistent (and significantly more negative) zetapotential potential across 6 measurements, but I was unable to reproduce that result.
To collect this data, I used 10 mM KCl with 1 mM phosphate buffer. Once the chip was inserted into the zetapotential device, the system was allowed to equilibrate for 5 minutes. I then would turn the pressure regulator knob, wait 30 seconds for the system to stabilize, and write down the applied pressure and measured streaming potential. The 0.00 pressure data point was collected last, after the system had been depressurized and I waited 30 seconds.
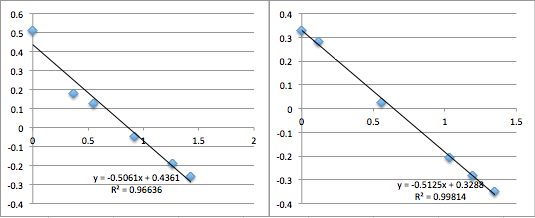
I apologize that all the graphs are unlabeled. X-axis is pressure in psi, y-axis is streaming potential in mV
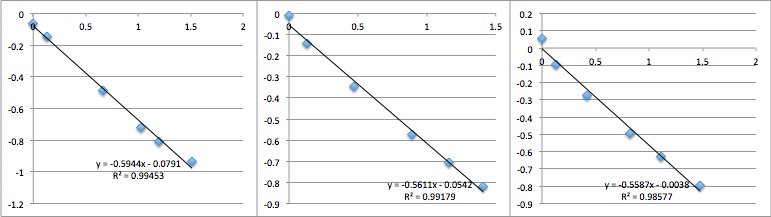
SiN 1015 Chip 7:
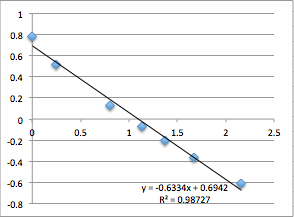
SiN 1015 Chip 8:

SiN 1015 Chip 9 (several successive measurements so you can see the downward drift):
SiN Chip 10:

SiN Chip 11 (two successive measurements):
You can see that the slope values are all 0.64 +/- 0.02, which corresponds to -22.4 mV. Next I did pnc-Si:
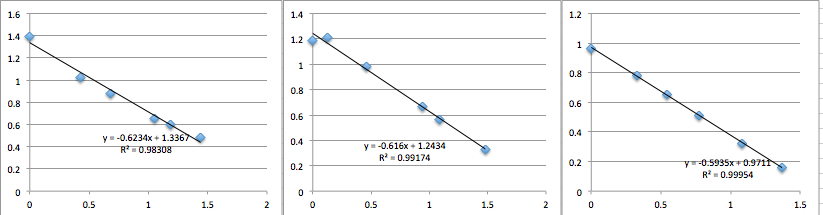
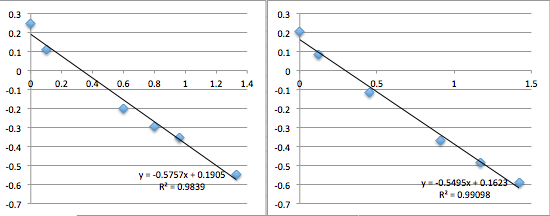
pnc-Si chip 1 (two measurements):
pnc-Si chip 2 (two measurements):
pnc-Si chip 3 (three measurements):
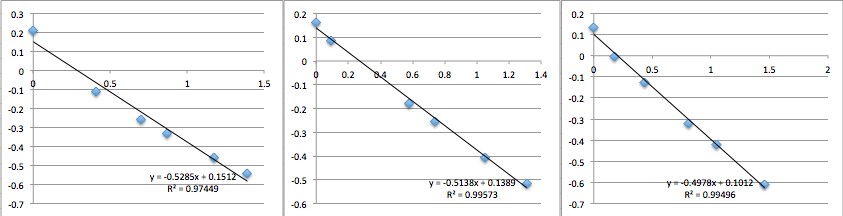
All the first and second measurement slopes are around 0.51, which corresponds to a Zetapotential of -17.85 mV.
I should have stopped here, but two things were bothering me. First, it was weird that SiN had a more negative surface charge than pnc-Si. Second, I wasn’t sure why the membrane potential would drift downwards, unless there was gunk in the solution. As kind of a grasping at straws thing, I remembered that in the Burns and Zydney paper linked below they had flushed all membranes with pure water prior to use to remove wetting agents. Obviously wetting agents aren’t a problem for SiN or pnc-Si, but I had passed my salt solution through a 0.2 micron filter, and I didn’t think in hindsight that I’d flushed it. So I came up with a pretty elaborate clean protocol.
Protocol: a 60 mL syringe is used to flush the zeta device with ~150 mL of barnstead deionized water. The same syringe is used to pass 40 mL of water through a new 0.2 micron filter. A new syringe is cleaned with water directly from the barnstead. A third syringe is used to draw up the 10 mM KCl buffer, and then the washed 0.2 micron filter is attached to the end. The filter is washed with ~2 mL of buffer, then the remaining buffer is filtered into the new, washed syringe. The syringe is attached to the zetapotential setup, and the system is flushed with 5 mL of buffer. When chips are inserted into the gap between gaskets, great care is taken that the fluid from the chamber doesn’t come in contact with ‘dirty’ surfaces.
When I went through that ritual, I got the following incredible data:
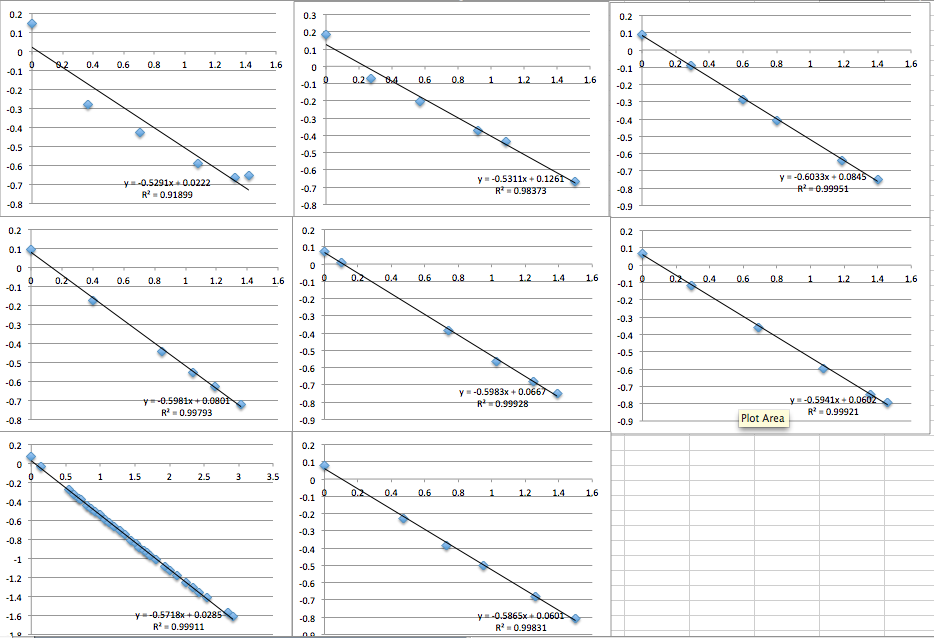
The first two data sets are very noisy, but then the system settles and is incredibly consistent with a slope of 0.6, corresponding to a streaming potential of -21 mV. For data set 8 I took a video of the voltmeter and manometer, then went back afterwards to put the numbers in. I was very pleased. But then I could not reproduce the result. Also note that because I thought the first two slopes in miracle chip 4’s data were due to a short equilibrium time, I changed the protocol so that the system sat for 30 minutes before I collected data.
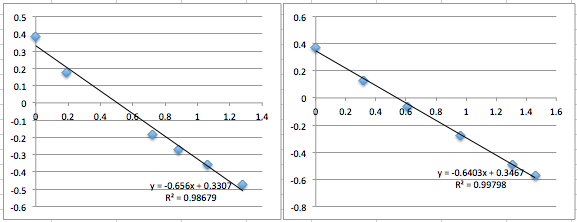
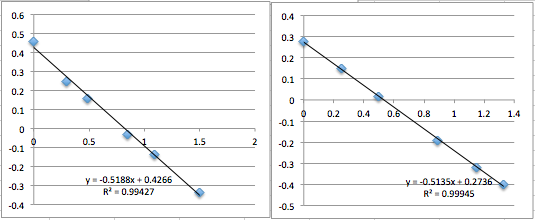
pnc-Si chip 5 (Same buffer solution as miracle chip 4, but the data was collected the next day. five measurements. Drifts downwards):
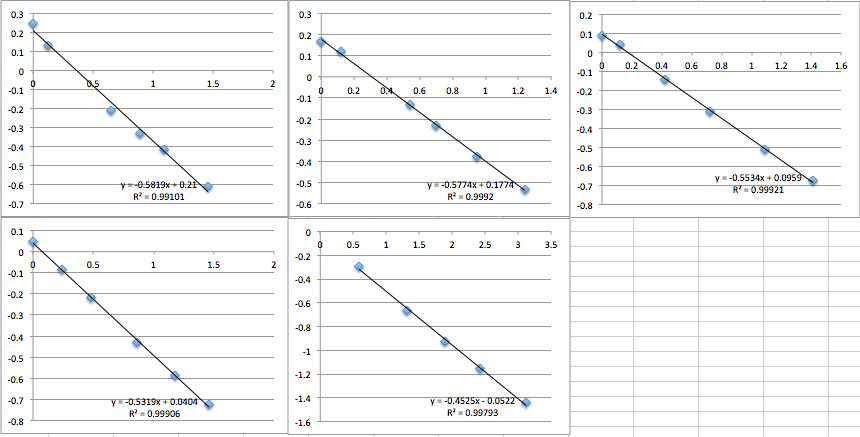
pnc-Si chip 6 (I re-filtered the buffer according to the clean protocol):
pnc-Si chip 7 (same buffer as 6, but I was more careful about inserting the chip into the setup):
pnc-Si chip 8 (re-filtered buffer):
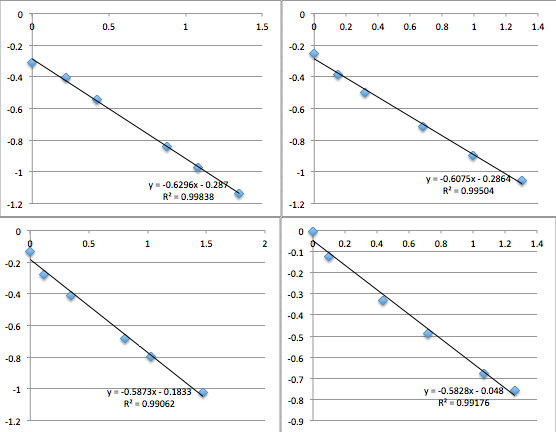
pnc-Si chip 9 (same buffer as 8):
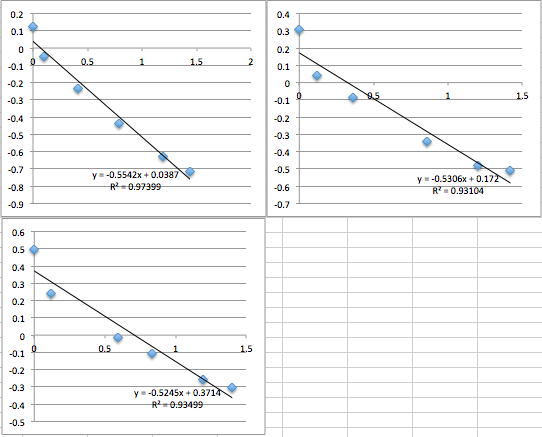
It was very late when I was collecting the data on chip 7, 8, and 9, and it began to feel like a nightmare. My data collection ability seemed to regress.
Going forward, I’m going to try to use fresher buffer. Burns and Zydney used salt solutions made from pre-weighted powder fresh each day. Maybe doing that will help me. I hope so.
Raw data for the excel spreadsheets: 3.8.14 Working Zetapotentials
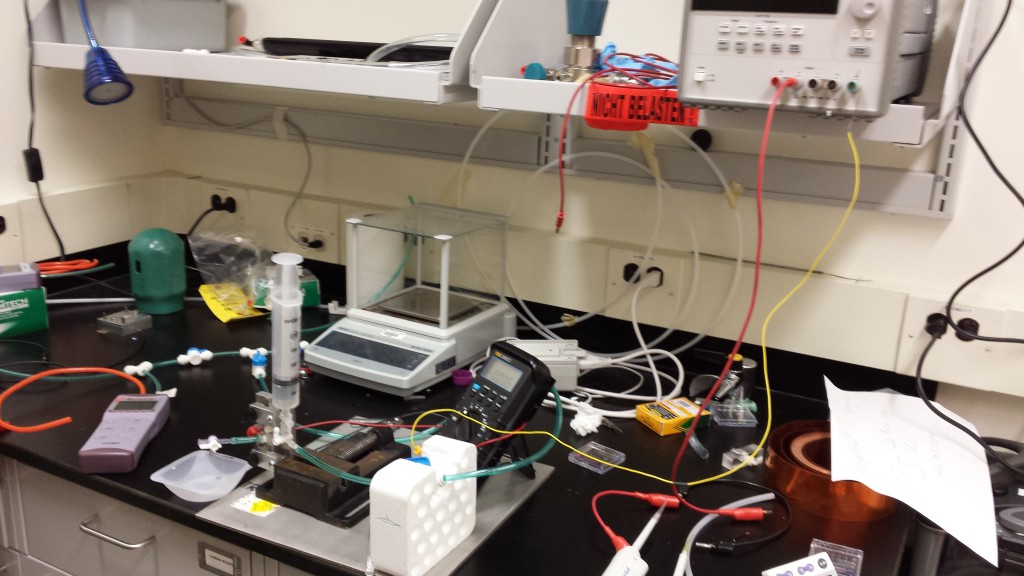
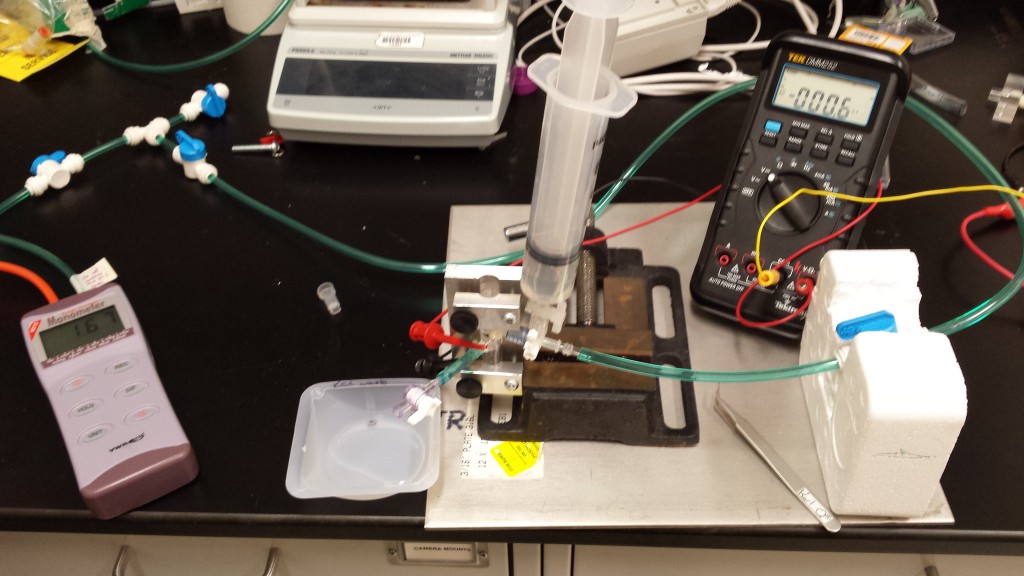
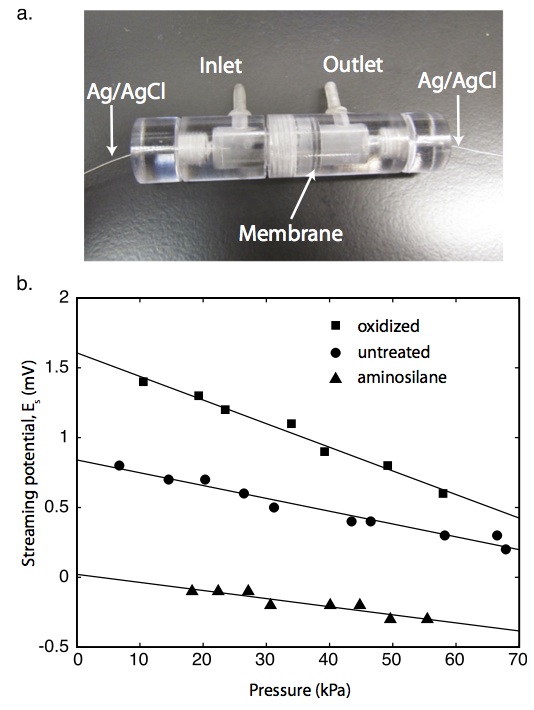
Current Setup:
The following is the setup in the basement:
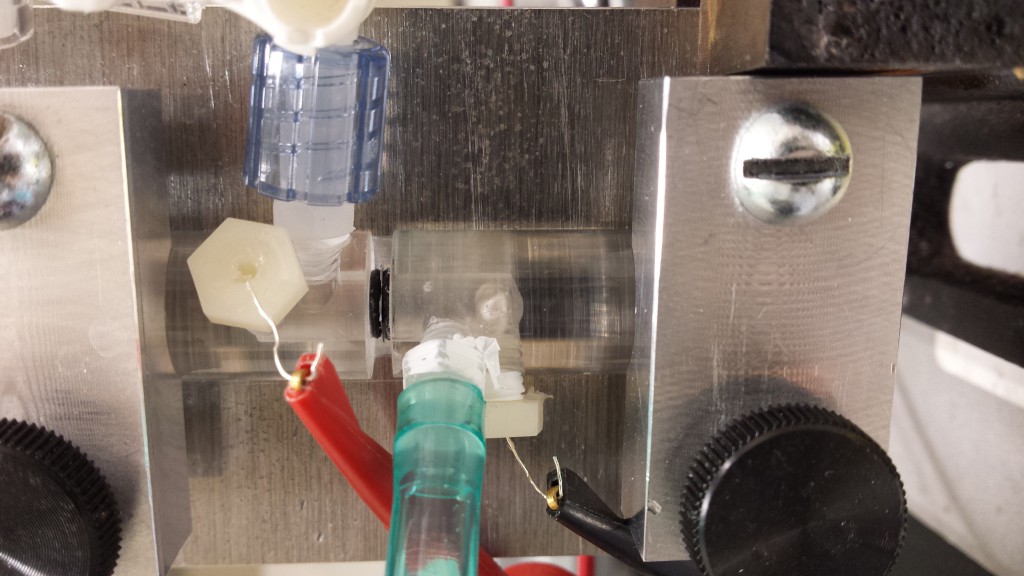
The method for inserting a chip is fairly involved. Bubbles are a source of transient voltages (I believe), and the odd space behind the electrode has a nasty knack for catching and hiding minuscule bubbles. Because I still get small transients that go away over time even when all common spots for bubbles have been visually certified bubble-free, I think that very tiny ones are clustering on the surface
Data Collection:
Jess –
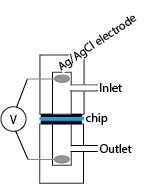
From Jess’s PNAS paper: The zeta potential of the pore walls was determined from streaming potential measurements. In these experiments, pnc-Si chips were inserted into the polycarbonate streaming potential device [that Jirachi is currently using]…Ag/AgCl electrodes were prepared using the method of Burns and Zydney [aka electroplating]… The chamber was filled with 100mM KCl and pressurized with N2… For each measurement the pressure was allowed to stabilize for 30 s, as displayed by [our digital manometer], and the potential difference was measured with [our current handheld TEK digital multimeter, accurate to within 0.1 mV].
The following images are from the supplement to that paper:
Zydney:
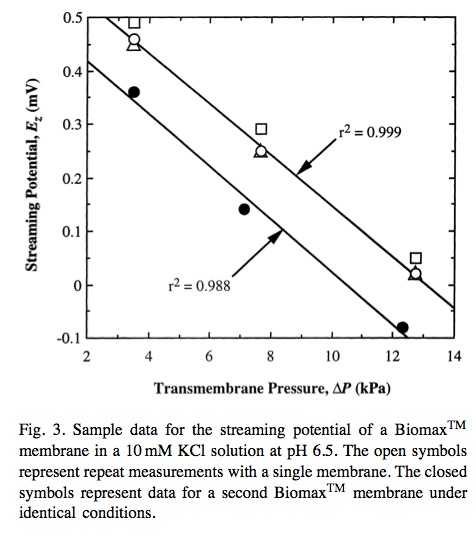
From Buffer effects on the zeta potential of ultrafiltration membranes (Burns and Zydney): The system was allowed to stabilize for approximately 30 min at which point the transmembrane voltage (Ez) was measured using a high impedance 8060A True RMS Multimeter (Fluke Corporation, Everett, WA) [accurate to within 0.01 mV] connected to the two electrodes. Streaming potential measurements were obtained at several discrete pressures up to 35 kPa with the system allowed to equilibrate at each pressure. Wilbert et al. [15] have shown that this approach gives more accurate and reproducible data than using a continuous pressure ramp as employed in most commer- cial zeta potential devices. The entire apparatus was then emptied and thoroughly rinsed with a new buffer solution to evaluate the zeta potential in different salts.
Relevant figure:
I began collecting data in as simple a way as possible. Recall the equation for Apparent Zetapotential is $latex \zeta = \frac{dE_z}{d\Delta P} \cdot \frac{\eta\Lambda_0}{\epsilon_0 \epsilon_r} $. I ran the numbers and we get the rather convenient relationship that $latex \frac{dE_z\text{mV}}{d\Delta P\text{psi}} $ *35 gives us the apparent zetapotential in mV. When I first had the device (and when I made this post) I would simply apply a pressure, and use the on/off switch to alternate between the given pressure and the atmosphere. I would collect three data points at zero and the given pressure, and if there was no variation I would move to a higher given pressure and take more data points. I would rarely wait more than 10 s for the number to ‘stabilize’. Standard data from this time looked like this:
| from 1/25/14. Untreated pnc-Si | |
| psi | mV |
| 0 | 0 |
| 0.6 | -0.3 |
| 0 | 0 |
| 0.6 | -0.3 |
| 0 | 0 |
| 0.6 | -0.3 |
| 0 | 0 |
| 0.6 | -0.3 |
| 1.7 | -0.7 |
| 0 | 0.2 |
| 1.7 | -0.7 |
| 0 | 0.2 |
| 1.7 | -0.7 |
| 0 | 0.2 |
| BROKE @ 2.7 psi | |
Between 0 and 0.6 psi, the two-point slope gives us a zetapotential of 17.5 mV. Between 0 and 1.7 psi, the slope gives us a zetapotential of 18.6 mV. I took a huge number of these two-point slope measurements, cheerfully ignoring the fact that the 0 psi values were often drifting and that a slope derived from two points is pretty useless. The values I got were:
SiN: 22.75 mV,
pnc-Si: 18.6 mV, 28 mV,
UV-ozone pnc-Si: 24.2 mV, 23.5 mV
YES pnc-Si: 18.6 mV, 18.6 mV, 19.6 mV
Alumina-coated SiN: 20.7 mV, 22.1 mV
A Word About Buffers:
Recall that zetapotentials without an associated pH are useless numbers. I had a great deal of difficulty maintaining steady pH’s. The addition of 1 mM Phosphate buffer fixes this problem. I used a combination of potassium phosphate monobasic and dibasic in proportion, such as given in this chart:
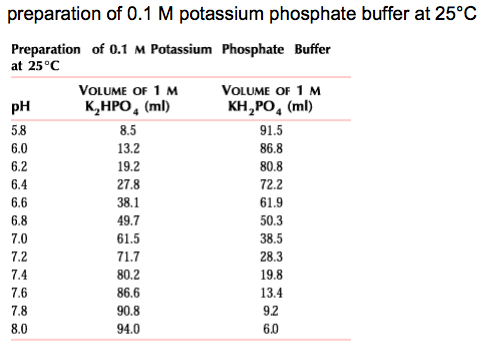
I used 0.01904 g mono- and 0.06264 g di- in 50 mL to create a 10 mM phosphate buffer solution, which I then diluted 10-fold down to 1 mM. Ultimately the buffer I used was 10 mM KCl, 1 mM phosphate, pH 7.39, conductivity 1606 microSiemens/cm. Re-measuring the buffer pH ~ 1 week later I got pH 7.42, conductivity 1702 microSiemens/cm. Typical conductivities for 10 mM KCl sans buffer are ~1350 microSiemens/cm.
10 mM buffer is standard in the biological world, and a 1 mM phosphate solution would not be considered well buffered. The problem is that the buffer contributes to the conductivity of the solution, and the mobility of the phosphate ions is harder to deal with mathematically than the potassium and chloride ions (which are preferred because they have almost identical electrophoretic mobilities). As long as the buffer concentration is 10 fold lower than the KCl cocentration we can ignore these effects (or at least Burns and Zydney did). This is also why I can’t use 1 mM KCl – although the mV/psi slope would be much steeper (and friendlier to the poor DMM, whose capabilities I’m really straining right now), the solution would need to be so weakly buffered we couldn’t trust it’s pH.