Modeling pore clogging
In recent posts we have tested the total volume of filtrate as a function of time in the centrifuge. We used NPN with different average pore sizes and we studied 100 nm and 20 nm NPs as well as IgG. We showed that while 100 nm NPs were completely blocked 20 nm NPs and the IgG were able to pass through the pores. We saw fairly similar plots of filtrate volume vs time even though the smaller solutes were able to pass through the membranes. Because the concentrations were relatively high, this wasn’t too surprising. We believe that a cake layer is formed at the surface of the membrane which suppresses/stops flow even for the smaller species. We’ve seen some evidence of this cake layer with the SEM.
There are many publications out there that attempt to model the reduction in flux over time in order to determine if the reduction is due to “pore blockage”, “intermediate blockage”, “pore constriction”, or “cake filtration”. This paper Reis 2007 by Reis and Zydney has a good summary and I used it as reference while trying to model our results. I don’t yet understand the differences between these models/equations, but I started out just hoping to see that our data would fit at all.

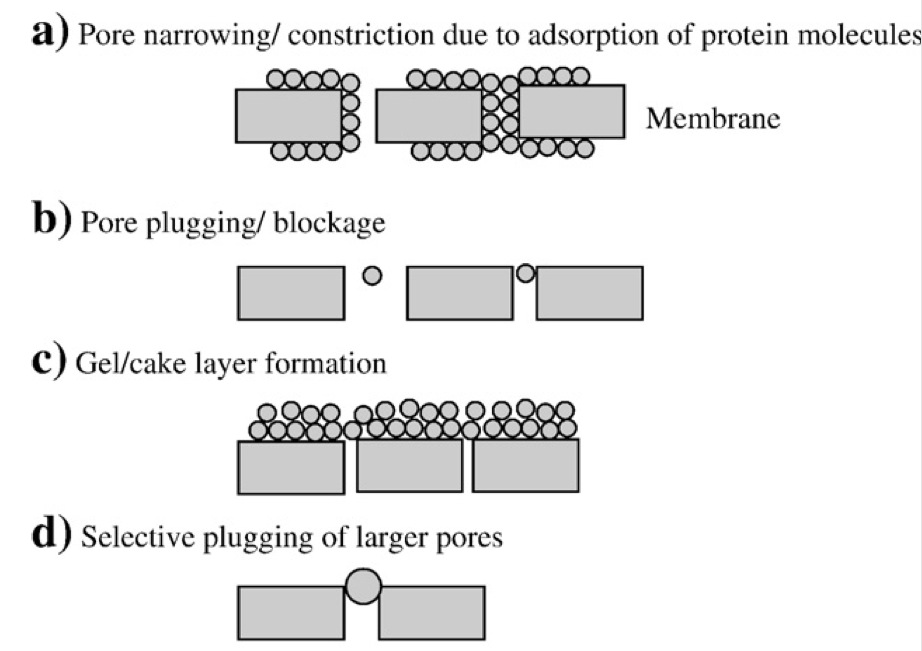
I also found some references that have schematics of the different clogging mechanisms. They don’t always use the same names and the equations they provide weren’t as simple to use, but here are two examples:
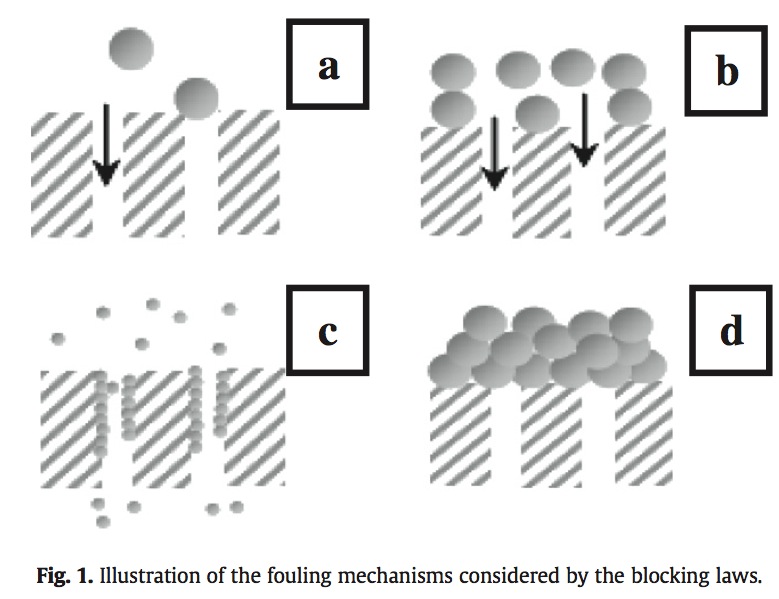
“(a) Sealing the pore of the membrane (complete blocking, n = 2): according to this model, each particle, bigger than the pore di- ameter, is retained at the surface of the membrane and completely blocks the entrance of the pores. Moreover, the particles never settle on other particles which have been previ- ously blocked by a pore.
(b) Partial blocking of pores (intermediate blocking, n=1): this model considers that the inner pore walls are covered gradually and uniformly by molecules smaller than the pore size. This de- creases the pore volume proportionally to the filtered volume. Therefore, the cross-section of the pores decreases over time.
(c) Internalporeblocking(standardblocking,n=3/2):aswellasthe complete blocking model, this model assumes that the molecules block the entrance of the pores. But, it considers also that mole- cules can settle on the others previously retained by the mem- brane. This means that not all molecules approaching the surface of the membrane block a pore entrance.
(d) Formationofadepositonthemembranesurface(cakeformation, n=0): according to this model, a deposit or cake is formed on the membrane surface by the retained molecules which are con- sidered bigger than the pore diameter. Cake thickness increases over time due to the stacking of molecules on the membrane surface.”
Next we present the flux vs time plots for the three different solutes. This is the same data shown in previous posts, but with the flux calculated from the filtrate volume, time and membrane area.

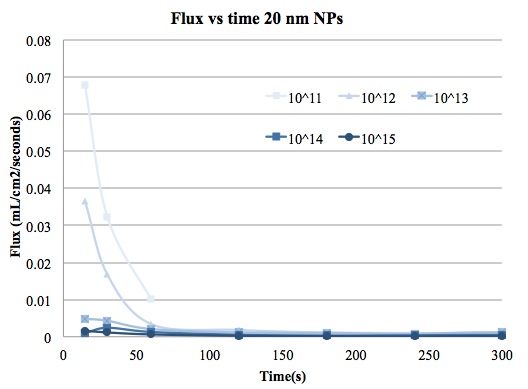
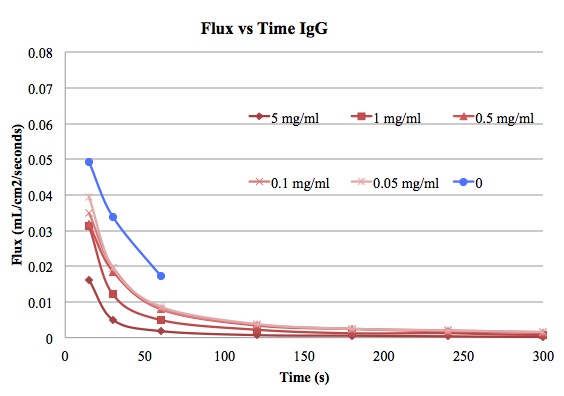
I used the flux at 15s as the initial flux so that flux/fluxo is 1 at 15 s. I don’t think that really works with the modeling, since flux/fluxo should only be 1 at time=0s, so I did not use the 15s data in my model.
I used Matlab’s curve fitting tool to fit the equation flux/fluxo = (1+a*t)^-b
I don’t know the significance of a, but b should tell us what type of clogging we are getting. For the 20 nm NPs and IgG I mostly got b~2 or much higher. The fitting usually had a low R-squared as well. Perhaps this is due to rapid changes at the membrane surface over the time of the test. Presumably the 20 nm NPs and the IgG are sticking to the edges of some pores and constricting flow and there is always a cake layer forming during and after this constriction.
Reassuringly, the model for 100 nm NPs fit b~0.5-1 with some R-squared values above 0.99. This makes a lot of sense if the 100 nm NPs are primarily clogging the filter with a cake layer.

I will continue to play with the fitting and try to getting a firmer understanding of what I am doing. I do think though that if we start working with larger volumes and lower concentrations (or larger membrane areas) we will get data that is further away from the noise level and end up getting better fits. There is probably error also originating from the start and stop of the centrifuge. Although we did get some data from the constant pressure cell, we did not get as many intervals in time, so it’s not possible to model. It would be very cool if a future set of experiments compared the two methods and showed a different clogging mechanism, as Jim has suspected all along.

This is great but … The pressure in the centrifuge decays over time as more material goes through. This will lead to an exponential decay in the flux that is independent of any clogging. The supplement of Tom’s paper has the formula.
Excellent point, but I have a hunch that the pressure difference is somewhat insignificant compared to the increase in resistance due to clogging. For a lot of these curves, the volume height isn’t changing very much so the pressure isn’t changing much. (of course, the fits are terrible for a lot of the curves as well….)
I agree that this experiment was not designed well enough to make any firm conclusions based on fitting the curves to the model. I just thought it was encouraging enough to warrant some discussion and possibly a new set experiments specifically planned to fit to the models.
I agree and I think this all makes for excellent discussion points in the paper.