Update: HUVEC migration on 0.5 μm porous substrates
This post is a brief update on the previous post of HUVEC migration on 0.5 μm porous substrates.
Brief Recap
We compared cell migration on nonporous (np), 0.5 μm low porosity, and 0.5 μm high porosity SiO2 membranes. Low and high porosity refer to a center-to-center distance of two or three pore diameters, respectively. For this post, we dropped the migration data for TCP (tissue culture polystyrene), sylgard 184 (1.8 MPa PDMS), and sylgard 527(5 kPa PDMS) for the sake of brevity.
CytoVu culture format

We seed at about 100 cells per sample, which has a membrane area of ~2mm x 2mm.
Below is an example of the HUVEC migration.
Results
n = 164, 159, 261 for for 0.5μm HP, 0.5μm LP, NP, respectively. In order to achieve this sample size, we have to pool data from at least 4 independent samples. The number of HUVEC per sample is ~40 under the field of view of the 10X objective (total magnification = 100X).
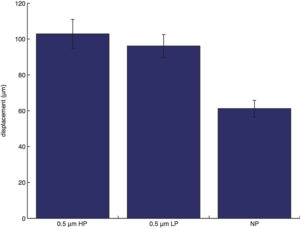
displacement (start to end distance of a cell trajectory):
maximum displacement (the maximum distance between two points along the cell trajectory):
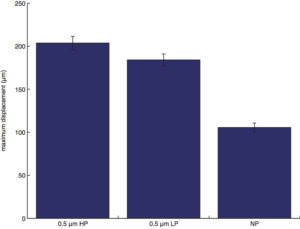
NOTE: If a cell travels a full circle back to its starting position, displacement would be 0, while the maximum displacement would be the diameter of the full circle.
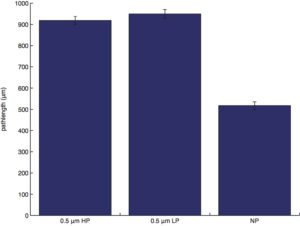
pathlength (total distance traveled by a cell):
MI (migratory index = displacement/pathlength):

NOTE: MI in a sense a measure of a cell’s persistence. If a cell travels in a straight line, MI will take on a value of 1.
average speed (pathlength/duration of cell migration):
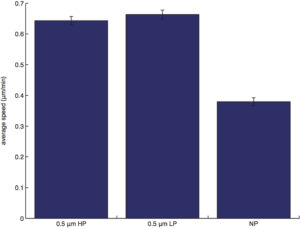
NOTE: The graph of average speed will look identical to the graph of pathlength if all cells are tracked for the same duration of time.
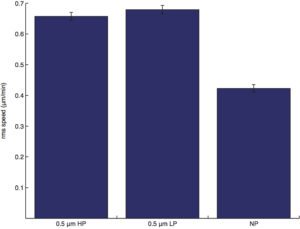
RMS speed (the root mean squared speed is obtained by diving the distance traveled after each time interval/the time interval, averaged along the entire cell trajectory.):
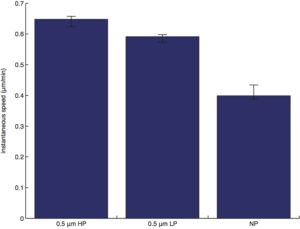
instantaneous speed (speed obtained from the curve-fitting/regression in accordance to the semi-persistent random walk model):
persistence time (obtained from the curve-fitting/regression in accordance to the semi-persistent random walk model):
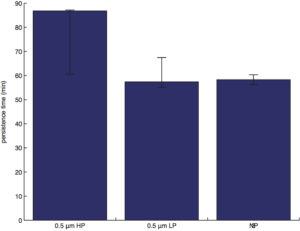
NOTE: Persistence time is the average time that elapsed before a cell changes its migratory direction.
Except for instantaneous speed and persistence time, the bars represent the means and the error bars represent the standard errors of mean. Since instantaneous speed and persistence time are asymmetrically distributed, we report the medians rather than the means for the bar graphs, and the error bars represent the 25th and the 75th percentiles obtained from bootstrapping (1 million times).
Semi-persistent Random Walk Model
The instantaneous speed and the persistence time of a given cell are determined by taking the regression of the cell’s mean squared displacement as a function of time in accordance to the semi-persistent random walk model, which stated that:

where MSD is the mean squared displacement, t is time, s is the instantaneous speed, and P is the persistence time (which represents the average time that elapsed before a cell changes its migratory direction).
The equation above is derived from the hypothetical scenario in which a cells obeys a fixed probability of turning as it takes the next step of migration. For example, if the probability is 1/8, then on average a cell will make a turn after taking 8 steps, and the persistence time would just be 8 multiplied by the time required for each step.
Example of mean squared displacement (MSD):

Note that by dividing the MSD for the step size of 1 by the time step between each imaging will yield the RMS speed.
For each cell, only the first 3rd of the MSD are used for the regression, and only cells with a coefficient of determination (r2) ≥ 0.99 were included in the analysis. Ideally, the higher the r2 threshold for cell selection, the better the cell conforms to the semi-persistent random walk model. However, we lose in sample size when we only choose cells with high r2 values in our migration analysis.
One question arises naturally — What is the sample size required in order for us to provide a statistically meaningful conclusion? I arbitrarily decided that if the mean RMS speed of the whole cell population and the median instantaneous speed of the semi-persistent walkers differ by less than 5%, then we have sufficient samples.
Below is an indirect way to convince myself that this approach is sound. I varies the r2 threshold for cell selection and see how the median instantaneous speed differs from the mean RMS speed of the whole cell population. As the r2 threshold lowered, the discrepancy increased significantly.
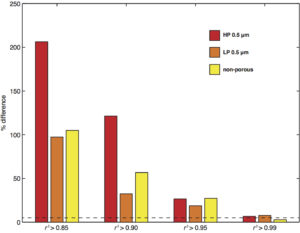
At r2 threshold ≥ 0.99, n = 31, 22, 43 for 0.5 μm HP, 0.5 μm LP, NP, respectively. It is worth mentioning that the instantaneous speed almost always over-predicts — that is, the median value is always greater than the mean RMS speed of the whole cell population in our data.
So in order to measure a faithfully representative value of persistent time, i increased the number of experiments until i have enough cells with r2 ≥ 0.99 such that the discrepancy between the median instantaneous speed of the semi-persistent walkers and the mean RMS speed of the whole cell population is reduced to around 5%.
Statistical Testing
displacement: non-porous is different (lower) from all, no differences otherwise.
maximum displacement: non-porous is different (lower) from all, no differences otherwise.
pathlength: non-porous is different (lower) from all, no differences otherwise.
MI: no differences
average speed: non-porous is different (lower) from all, no differences otherwise.
instantaneous speed: differences seen.
persistence time: no differences.
Instantaneous speed and persistence time are analyzed using the non-parametric Kriskal-Wallis test (alpha = 0.05). All others (pairwise comparison) are analyzed using the Tukey HSD test (alpha = 0.05).
Conclusion
The statistical tests suggest that cells migrate faster on porous substrate (high and low porosity 0.5 μm vs non-porous SiO2), but there are no differences in directionality.
Future Work
- Assess if there is a preferred direction of cell alignment and cell migration on the porous substrate.
- Perform the same study for the 3 μm SiO2 membrane.
- Include a different analysis of cell migration, which determine the step-by-step change in cell speed and directionality.
- Stain for fibronectin and see how cell speed and directionality correlate with the intensity and the fiber length of fibronectin.
Sneak preview of future work #3:
As the cell steps through the trajectory its center is plotted with green dots. the dots are plotted in red if the cell is about to make a turn ≥ 45°. The color of the trajectory indicates speed (min to max = blue to red). Note that as the cell crossed it’s old path it started to linger, most likely because it is exploring the ECM molecules that it had deposited before. Under such scenario, the semi-persistent random walk model no longer applies. This particular cell has the r2 value of only 0.039057, and would be excluded from the analysis if we are just using the semi-persistent random walk model.
detailed trajectory:
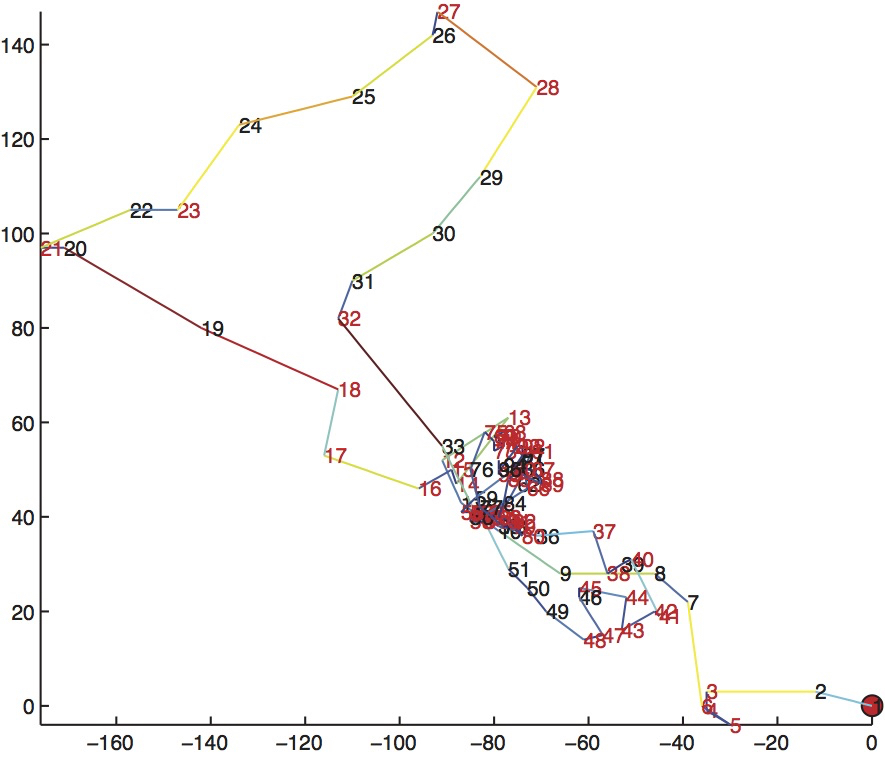
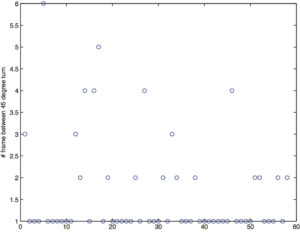
Red number indicate the frame right before the cell makes a ≥ 45° turn. The color of the trajectory indicates speed (min to max = blue to red).
plot of the number of frames before a cell makes a turn ≥ 45°: