Update on Track Etched Membranes Experiments
Hello Everyone,
As you probably remember, We have been working on optimizing Track Etched membranes devices since last semester, these membranes are 80 nm pore size and our beads are 100 nm in. We have been working on the design to make devices work since the first day of these experiments because of different reasons like the new upside down design because these are not transparent, then leaking problem which made us to optimize the design again and also high resistance of these membranes. Right now this is the design that we have for our experiments:
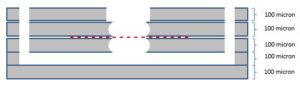
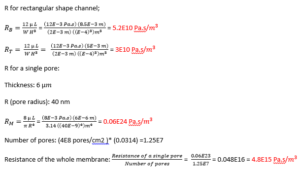
The other problem in the system is that, the membrane is resistive compared to our membranes, because of the thickness of the membrane (6 micron), in our experiments, we were getting almost no flow to the top channel which was acceptable by simple math over resistance of the channel, and the membrane (Membranes are 5 orders of magnitude more resistive compared to the channel).
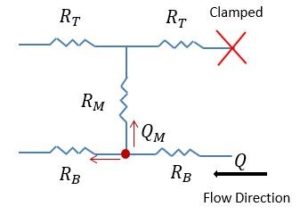
In order to solve this problem, we applied the pulling idea in the system, but we are still working on it to figure out which flow rates we should use to have enough flow to the top, and it gets more confusing when you get the flow to the top but you are not sure if the flow is coming from the bottom channel and passed through the membrane or there is a leaking in the system which leads to getting the flow to the top channel, because if we apply a high flow rate for pulling, and the membrane is not capable of handling that flow rate, leaking would happen.
Our experiments on TE membranes are divided in 2 parts:
- Exosome Scale Experiments:
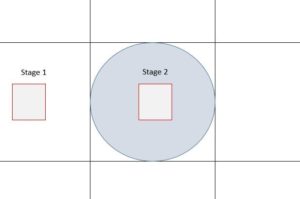
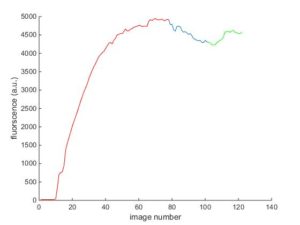
We are working with 80 nm pore size membranes and 100 nm beads. The goal of these experiments is to study the fluorescent intensity of different steps in the system such as capturing, cleaning, and releasing. Again we are still working on optimizing and finding the proper flow rates. For example in stage 2, we take images during the capturing, cleaning, and releasing and study the change in fluorescent intensity in each step.
In one of our experiments with these conditions:
Flow Rates: 10 microliter/min for pushing and 2 microliter/min for pulling
Volume: 600 microliter
The result shows increase in the intensity during capturing and decrease the intensity in cleaning, but no drop in intensity after releasing was observed which might be due the beads that are still floating and not washed away.
We also have a Matlab code which plots a graph for us to show the changes in the fluorescent intensity during the experiments:

After seeing these videos and others from all of these experiment, we started thinking that maybe features and particles that we were seeing in our experiments by 100nm beads are actually, beads and not aggregates. This idea came to my mind at first when i was seeing a large number of these beads in my experiments as you can see in this video:
We can verify that these particles are beads and not aggregates by these experiments:
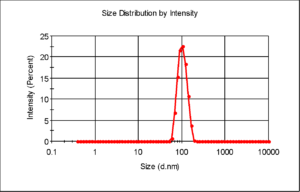
- DLS data:
I had some DLS data for size distribution of these beads which shows a sharp peak over size range 100 nm, which indicates that aggregation is not an issue and the results can be found here:
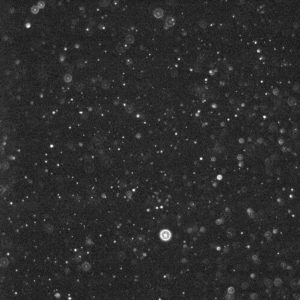
- Counting:
Henry and i did another experiment and we imaged a 100 time diluted sample which is expected to have 1.8 * 10^11 beads/mL.
(1002 pixels* 1004 pixels) (1.31 micron/pixel)^2 (500 nm as focal volume height) = 863205 micrometer cubed
Using a matlab code, 8921 particles were counted in our image which leads us to
10^10 beads/mL which is close to the number of beads in solution.
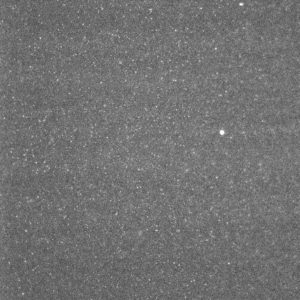
- Filtering:
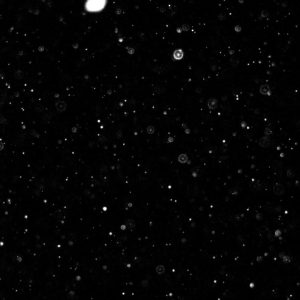
We filtered samples using 200nm filters and check them before and after filtration under microscope on cover glass:
before:

After:
2. Scale Up Experiments:
The goal of these experiments is proving our concept using scale up experiments, these are 10 micron beads over 8 micron pore sizes that we can easily see them under microscope, unlike small pore size membranes, these are so permeable, so we don’t need to apply the pulling idea in these experiments.

First Experiment:
This was my first experiment in the scale up system, these 2 videos are capturing and releasing steps of the experiment.
Second Experiment:
This experiment was done in scale up system and the flow rate was 10 microliter/min, unfortunately we had an air bubble in releasing step so we couldn’t release the captured beads. But as you can see in the capturing video, beads are getting captured by pores due to the transmembrane pressure. The video is made by merging GFP and DIC images during the experiment.
Third Experiment:
This experiment was done by high flow rate: 90 microliter/min and again with 10 micron beads over 8 micron pore size. In the following videos you can see successful capturing and releasing of beads in the system. Please note that there is no pulling in this system because the membranes based on their large pore size are permeable enough that we do not need to apply the pulling idea and the flow goes to the top channel as well as the bottom channel and this is in agreement with math calculations over the resistance of the membrane and the channels which showed that they are too close to each other.