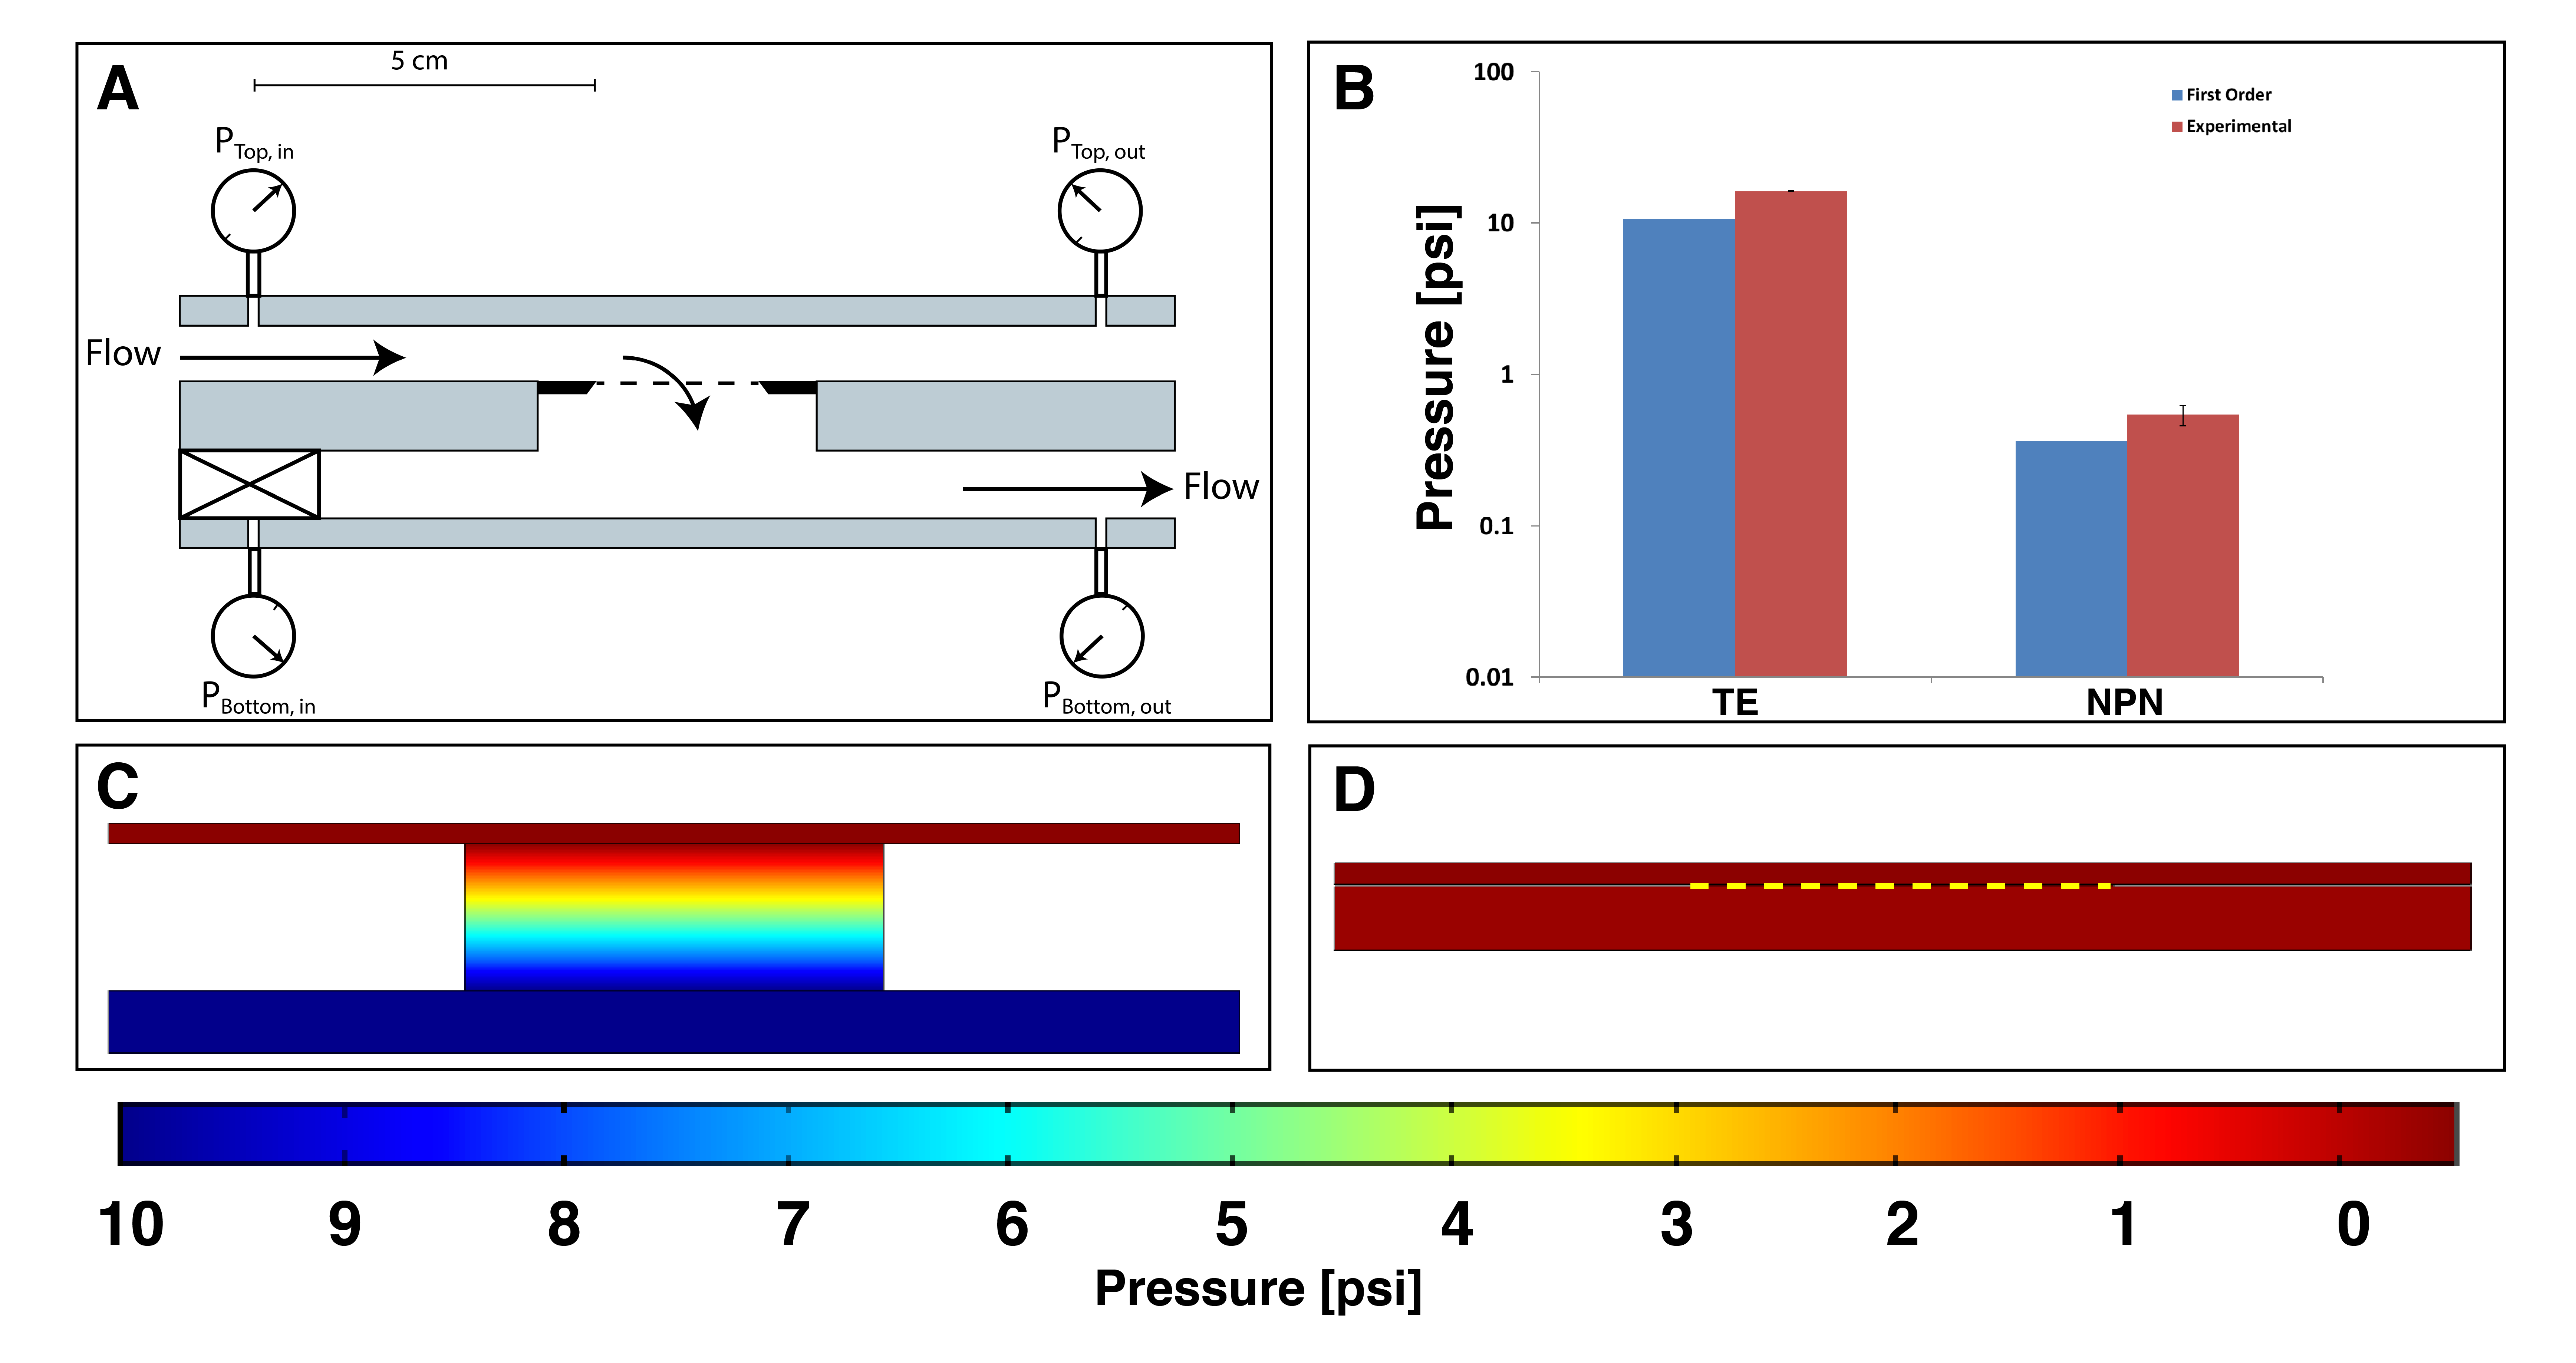
Exosome Paper Figures
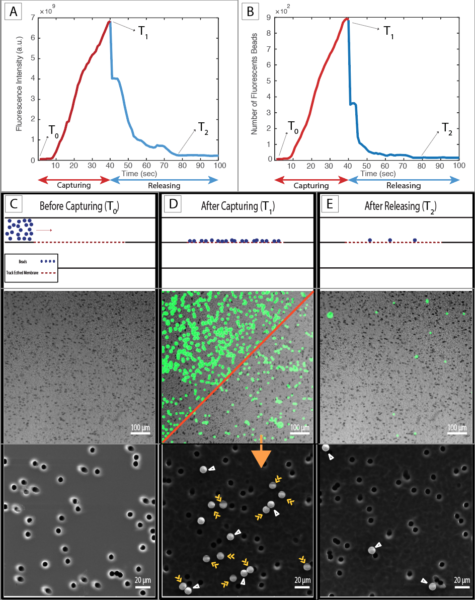
Figure 2 – Micro scale Experiments with 10 micron fluorescent particles and 8 micron pore size track etched membranes: A) Fluorescent intensity – time plot showing increasing in the intensity signal during the capturing step and decreasing for releasing step. B,C and D) Before capturing, After capturing and After releasing panels, respectively, including schematic images (Top), Fluorescent image (Middle) and scanning electron microscopy (Bottom).
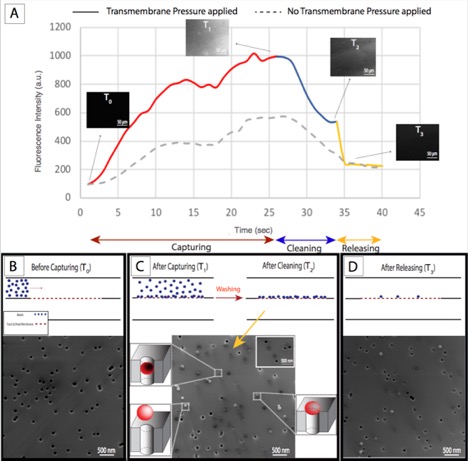
Figure 3; Exosome scale Experiments with 10 nm fluorescent particles and 80 nm pore size track etched membranes: A) Intensity analysis plot with solid line which is from the interaction area where the transmembrane pressure is showing the increasing in the intensity during the capturing step, and then decreasing with the cleaning step following by a drop in the intensity signal as nanoparticles were released while the dash line indicates where there is no transmembrane pressure as the control. B, C and D) Before capturing, After capturing-cleaning, and after releasing panels respectively showing the nanoparticles that were on-pores, inside-pore channel and non-specific captured nanoparticles.
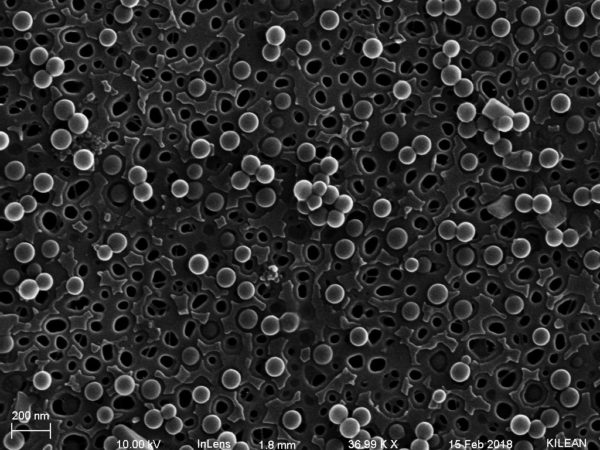
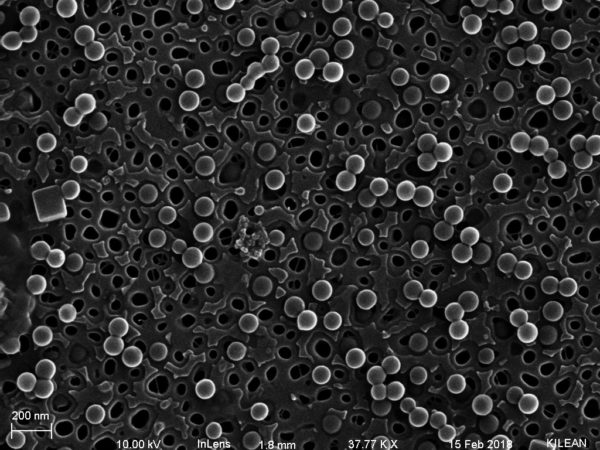
Figure 4; 100 nm fluorescent nanoparticles on NPN membranes:
Scanning Electron Microscopy for after capturing:
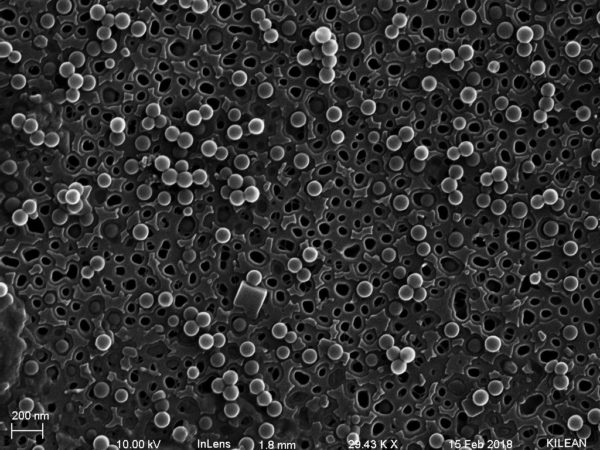
Scanning Electron Microscopy after releasing:
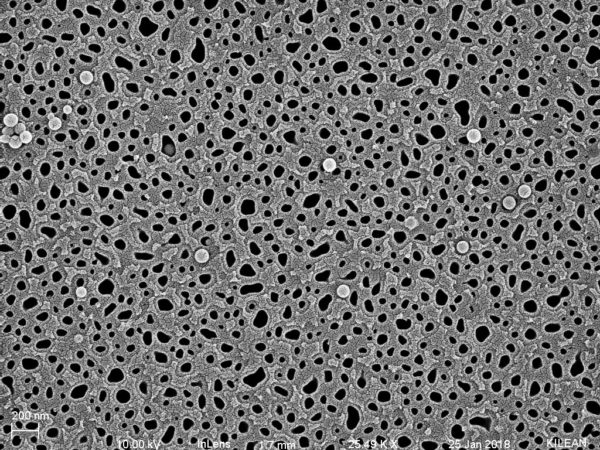
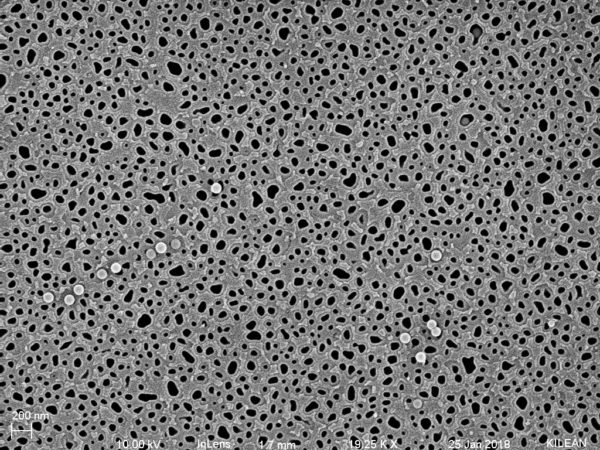
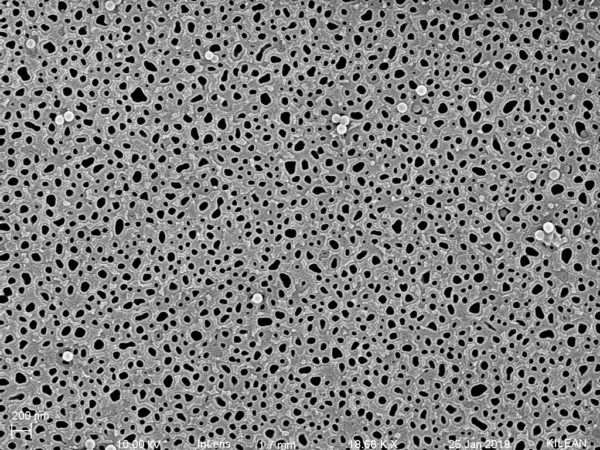
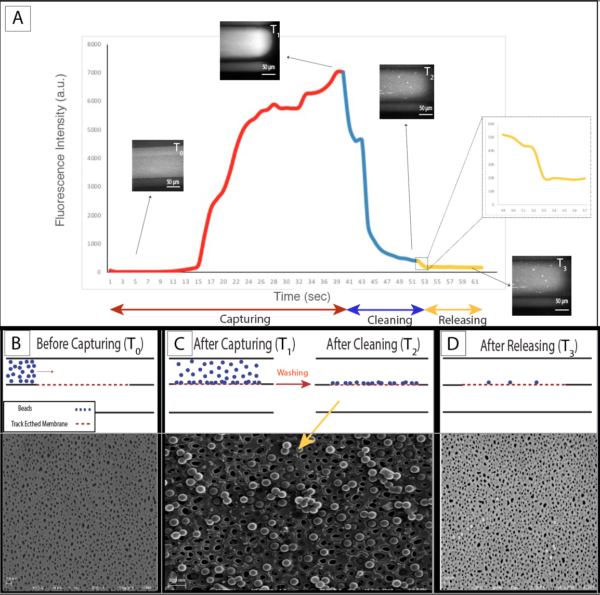
Figure 4;
Figure 5: