Immobilized Graphene Oxide Nanolaminate Elution Test
Recently we were interested in finding out how many particles from our immobilized graphene oxide (GO) nanolaminates are delaminated into suspension due to shear stress. We wanted to compare this concentration to those found in our previous hemolysis studies to determine if the delaminated particles would lyse red blood cells. In order to determine this, we built two microfluidic devices (GO and a teflon control) and pumped ultrapure water through them, analyzing each of our samples with NTA (Nanoparticle Tracking Analysis).
The devices consisted of three layers: the base, a channel, and a top piece/tubing insert. The base consisted of either a strip of teflon or a glass slide with our immobilized GO nanolaminate. A channel was created by cutting a piece of double-sided tape. This was attached to the bottom slide. The top piece, which was (of course) added on top of the channel, had two holes cut out of either end to allow our tubing to be inserted.
We used a syringe pump to pump ultrapure water through each device. The flow rate was determined using the following equation, with tau being shear stress, Q being flow rate, mu being the viscosity of water, h being the height of the channel, and w being the width of the channel.

In order to obtain a shear stress of 10 dynes/square centimeter (which we have previously found to be physiologically relevant), we needed a flow rate of 250 microliters per minute, or 1 mL per 4 minutes.
Prior to using our devices, we ran a tubing control. We were concerned that the tubing itself would contribute particulate to our samples and skew our results. Therefore, we connected the tubing to the syringe pump and pumped 1 mL of sample through the tube, collecting all of the sample after one pass. This was done 5 times for a total of 5 samples, each with 1 mL of solution. Each of these samples was then analyzed with NTA. After this, we ran ultrapure water through our devices in the same fashion as that described above using the same tubing we used for the control. These samples were also analyzed with NTA. The average concentration of samples for each sample type can be seen below.
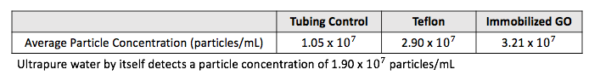
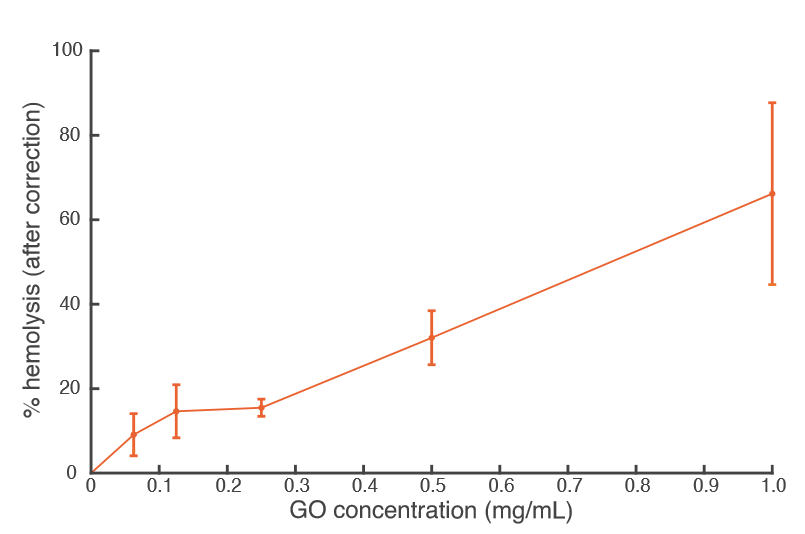
The tubing control samples (1.05 x 10^7) actually had a lower average concentration than the concentration of particles detected in regular ultrapure water (1.90 x 10^7). We think this is due to the NTA itself, as the NTA can accurately measure between 10^7 and 10^9 particles. We are very close to the lower limit, which could explain why the control has a lower concentration than plain ultrapure water. It is also possible that some of the particles from the ultrapure water actually adsorbed to the tube’s surface. Additionally, the immobilized GO nanolaminate concentration (3.21 x 10^7) is not much larger than our teflon control (2.90 x 10^7). This is a positive result, as it could indicate that there are few GO particles being delaminated. In fact, the concentration of particles we found in this experiment would not cause any hemolysis according to our previous findings. Our most recent percent hemolysis data (left) indicates that concentrations of GO as low as 0.06 mg/mL will cause lysis. If we were to follow the trend of the NTA plot (right), this GO concentration would result in a particle concentration to the order of roughly 10^10. Therefore, a suspended GO particle concentration to the order of 10^10 causes hemolysis. The particle concentration we have found in this experiment is only to the order of 10^7 — three orders of magnitude lower than the value that causes hemolysis. This is very good news, as this means red blood cell lysis due to suspended GO particles will likely not be an issue in our application.

We also ran another experiment where we followed the same procedure using the same devices. We pumped red blood cells (RBC) through the devices rather than ultrapure water. RBC from whole blood were first washed and diluted down to 5×10^8 RBC/mL using HBSS buffer. This is identical to what was used for our previous hemolysis experiment. These isolated RBC were passed through both devices and then collected in the same way as described above. The rest of the procedure followed that of the hemolysis experiment. Briefly, samples were incubated at 37 degrees Celsius for an hour and then centrifuged at 12,000 rcf for 10 minutes. The top 100 microliters was then used to dilute each sample 1:10 with DI water. A spectrophotometer measured the absorbance of each sample at three different wavelengths, which allowed us to calculate the hemoglobin count. The amount of hemoglobin present in the sample indicates how much lysis there is. Thus, percent hemolysis was calculated using these hemoglobin counts.
Our results from this experiment were somewhat strange — the percent hemolysis for the GO samples was in the negatives, while the teflon control was low (either zero or very close to zero). This could be a good thing, indicating that our immobilized GO nanolaminate samples had such small traces of hemoglobin that the percent hemolysis was actually in the negatives. It is also possible that this was a fluke. We hope to repeat this in the near future to see if we get different results. We also plan to run a similar experiment where we pump the RBC through the devices at different flow rates, again testing the amount of hemolysis that occurs. Based on what we have found in these experiments, we expect those measurements to be very low.