Adsorption Quantification VI
Recently I tested track etched membranes and crystalline silicon (basically the backside of the membrane chips) following the sample buffer adsorption assay. This new data comprises the last two bars on the following chart.
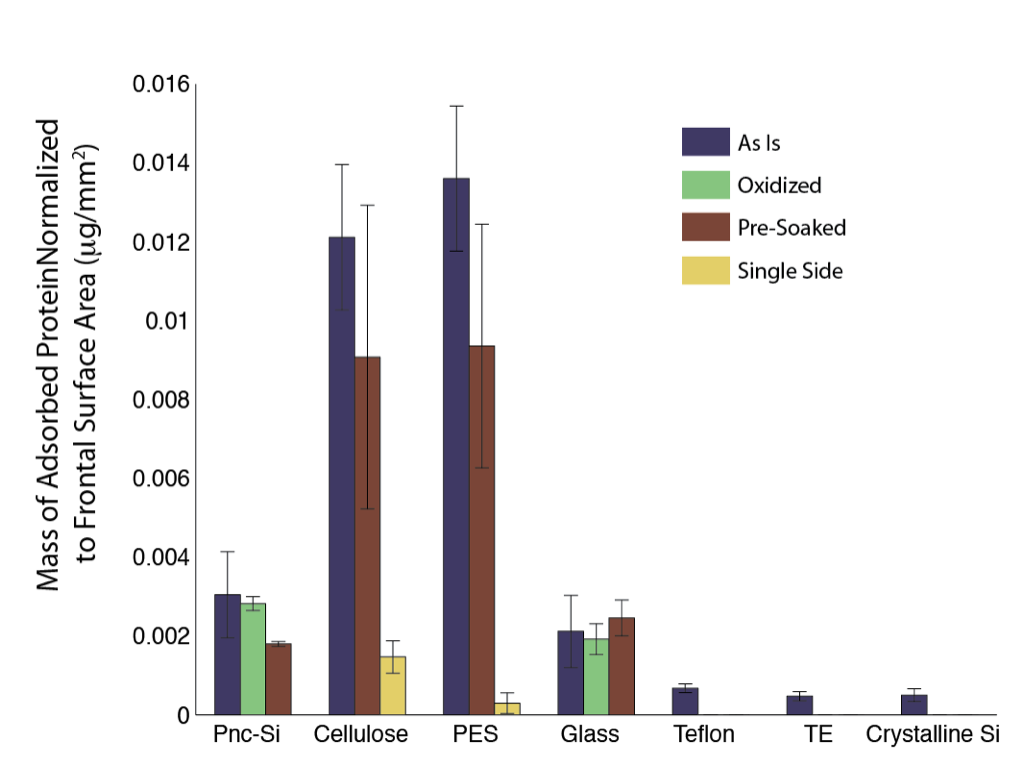
I’m surprised to see that crystalline silicon is so low in comparison to pnc-Si. This is something I’d like to test one more time with a fresh protein sample. These crystalline silicon samples were old chips which should have a native oxide coating, but they haven’t been altered in any other way.
Completely unrelated, I will be performing AFM this Tuesday afternoon at the Krauss lab. I’ll try to use samples with the biggest pores possible in case their tip is insensitive.
The TE is surprising too. I wonder if we removed the PVP with the hot water treatment that Maryna learned about …
We still need to know what the literature already says about the comparative protein binding for cellulose and PES (TE too I suppose). There is lots and lots of data out there and ours needs to fit the consensus or the method will be rejected.
Lets review something relevant in journal club. Maybe open up a topic on ‘membrane fouling’ on the knowledge wiki so we can grow and collect our knowledge on this important topic.