Adsorption Quantification I
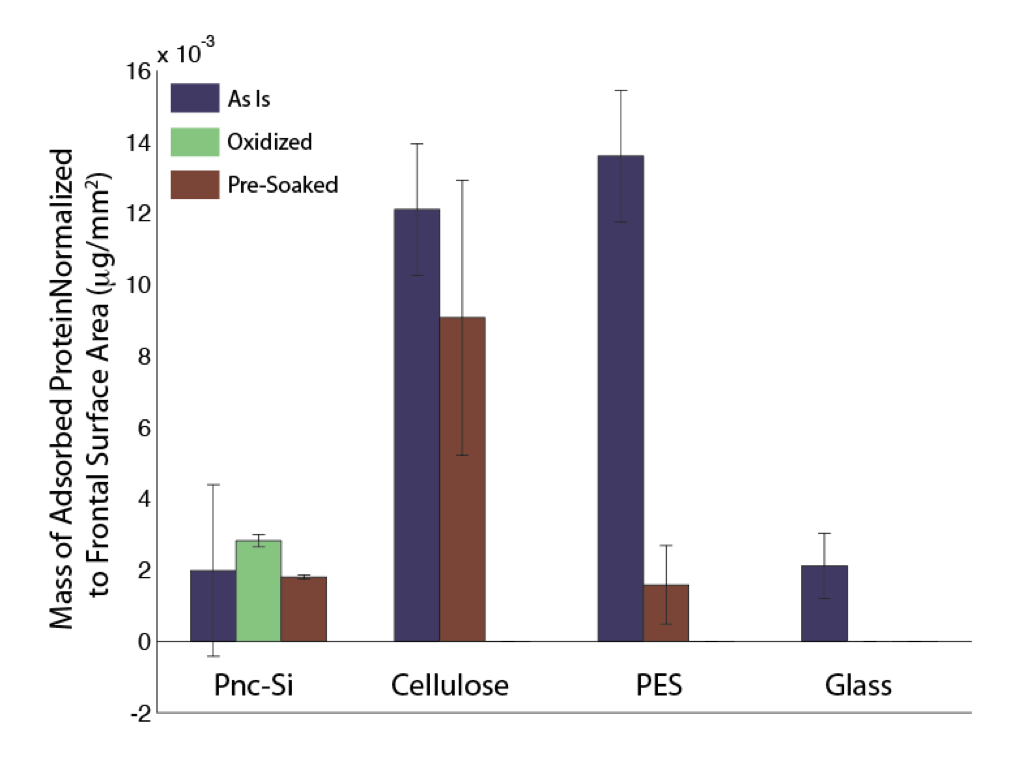
UPDATE: Figure normalized by frontal surface area. This brings the glass data in line with pnc-Si (which is similar to my more recent fluorescence data).
Here is my first try at putting together all the recent adsorption gels I’ve done. This data has all been obtained using the more vigorous washing step. All densitometry performed using ImageJ and mass standards.
Conclusions:
- Oxidation and presoaking pnc-Si does not seem to further reduce adsorption.
- Presoaking PES seems to lower adsorption, but does not affect cellulose
- Untreated PES and Cellulose are much more sticky than pnc-Si
A couple of things I will try to do in the future:
- Redo the first untreated pnc-Si gel, I think the standards may have saturated and caused me to get the large negative error there
- I will try oxidized and presoaked glass
- Track etched membranes and polystyrene are also on the menu – as is, oxidized, and presoaked flavors
- We talked about normalizing to area, but I’m not sure how to go about this. Include total surface area for polymer membranes? This would make them appear to have less adsorption per unit area and more adsorption as a whole because of high surface area.
Normalize to frontal surface area.
Even if the fluid contacts both sides in some cases but not others?
Yes. This is the most straight-forward normalization and we can interpret the results based on the different methods and structure after.
Ok… it’s up now.
Change the axis label to ‘frontal surface area’ to be a bit more descriptive
The pnc-Si and glass data seems reasonable to me – you are adsorbing around a full monolayer – therefore the material itself is fairly sticky. This has been confirmed by our TEM – nearly full adsorption to the surface of the pnc-si. Thank god there is little surface area.
I suppose the PES and cellulose also make sense – adsorbing ~5X more protein with likely 1000X more surface area, so the material is not stickly at all…
What’s the take-home message, and how can we use this info?