Fluorescein transport: O-ring position and wafer variability
After diffusing through a polymeric or pnc-Si membrane in the transwell format, diffusing molecules meet an “unstirrred water layer = UWL” on the bottom of the membrane. The UWL acts as another resistance to transport into the receiver compartment. According to some PAMPA papers, the UWL can be greater than 1 mm in thickness without stirring. I hypothesized that the disk of volume between the bottom of the pnc-Si chip and the bottom of the Sepcon housing (due to the O-ring and plastic) might allow the formation of a “void volume” of little mixing with the receiver bulk volume in addition to the UWL.
To test this hypothesis, I assembled Sepcons by adding the O-ring first and then pnc-Si (O-ring bottom) or by adding pnc-Si and then the O-ring (pnc-Si bottom). The “pnc-Si bottom” set-up eliminates the 1mm spacing due to the O-ring. I used SC065 chips without pinholes and stirred the samples on the tabletop VWR orbital shaker at 100 rpm.
Experimental details: Vd = 100uL; Vr = 1000uL; Cd = 0.00075%; gain = 0.000125%; 10×10 circle, 1000um border
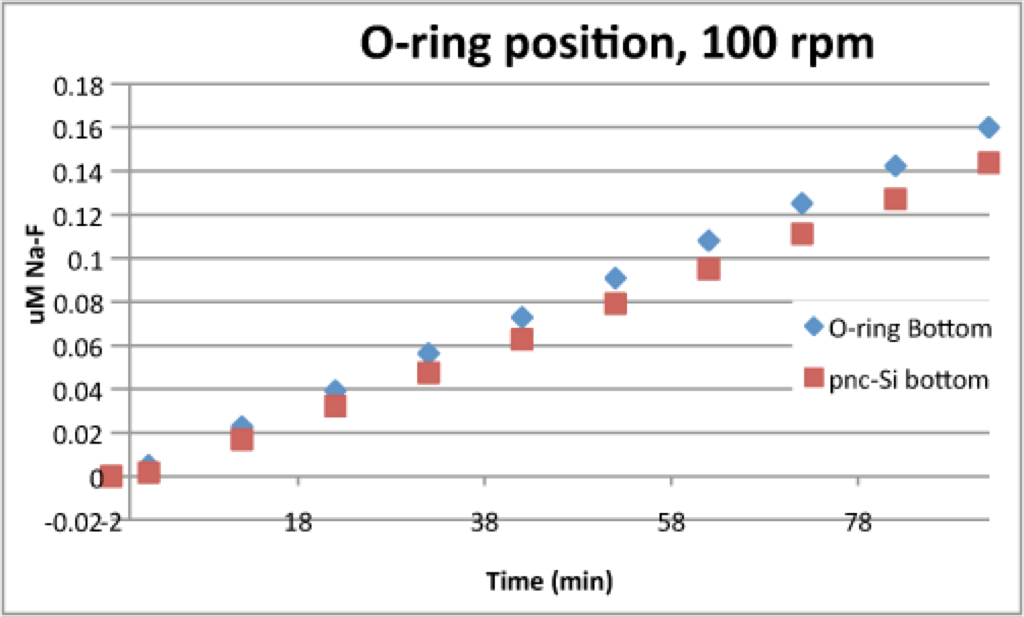
To get this data, I subtracted the fluorescence from a blocked pnc-Si transwell, i.e., one that I coated with nailpolish to prevent Na-F transport. This graph shows that there is very little difference between the 2 O-ring configurations, surprisingly. In fact, the set-up which I though would be less ideal (O-ring bottom) showed slightly more transport. I believe Christine has some data to back this up…
After I did this experiment and plotted out the data, I realized the data from SC065 didn’t match what I remembered from an earlier experiment with SC048. Here, I plotted the Na-F transport through SC048 and SC065 – both without pinholes. This data is also reduced by the “blocked” pnc-Si transwell fluorescence.
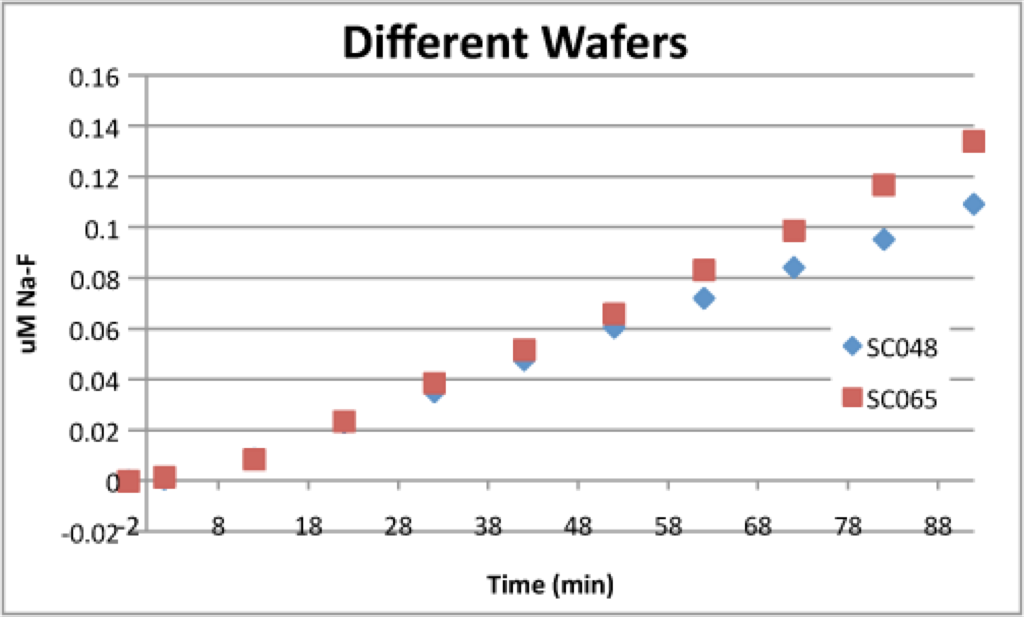
Actually, the data doesn’t disagree as much as I expected. I think it might be useful to do some pore processing of these wafers to see if porosity/pore size might explain this difference. Over the next couple of weeks, we’ll have a bunch more transport data for pinhole-free membranes (hopefully), so these 2 curves might not be explained by membrane variability. Rather, this might be due to experimental variability (Sepcon assembly, Sepcon geometry in the 24-well, plastic differences, hands).