f-BSA Adsorption on Adarza functionalized pnc-Si chips
Chips of pnc-Si were funtionalized at Adarza. They returned four groups of chips. Ethanolamine, Amino PEG-1, Inactivated sLinker, and Amino PEG-2. These were all incubated with PBS and 5-mg/mL f-BSA (2:3) in a humid refrigerated dish. The samples were rinsed in PBS then DI water and dried with filtered compressed air.
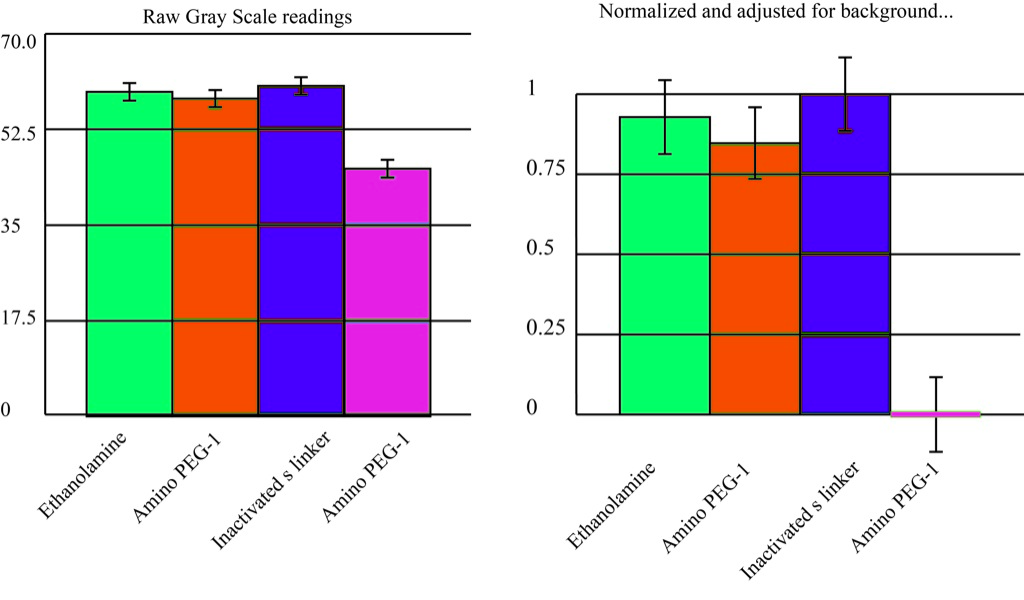
The measurements were taken with the fluorescence microscope and analyzed with ImageJ. Figure 1a shows the averages of the gray scale as measured. For reference, the background measured last week on a PEG chip with no BSA was 55. Removing this background signal and normalizing for the highest signal, inactivated sLinker, gives the graph in Figure 1b. I do not know what the difference between PEG-1 and PEG-2, but there does seem to be one. We’ll have to ask Chris about this.
Katia has another set of chips to try some improvements to her process. I also gave her some partially broken square sepcon chips with windows so she can let us know if her process can be done without breaking the fully clamped membranes (aka ‘free standing’ membranes)