Beginnings of a pore formation model
During the history of pnc-Si fabrication, we have always observed that pore formation is intimately related to the crystallization process. In general, large nanocrystals in a film correspond with larger pore diameters. A partially crystallized film will have a low density of films. Following the work that describes crystallization of a-Si in terms of kinetic equations and thermodynamic quantities, I propose to create a model of pore formation with a similar approach. Below are my initial attempts at making the analogy between crystal growth and pore formation.
The Arrhenius relationship is a kinetic equation that describes the rate of a chemical reaction with respect to temperature.
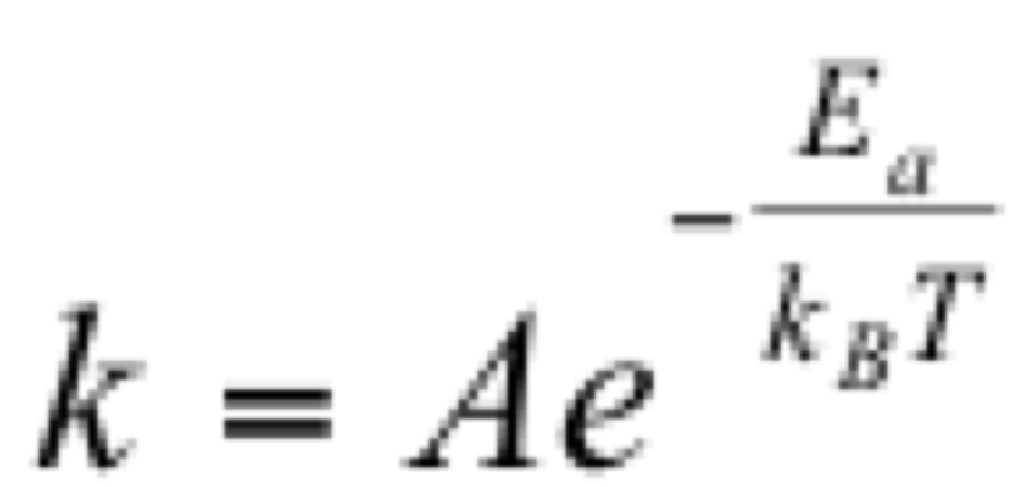
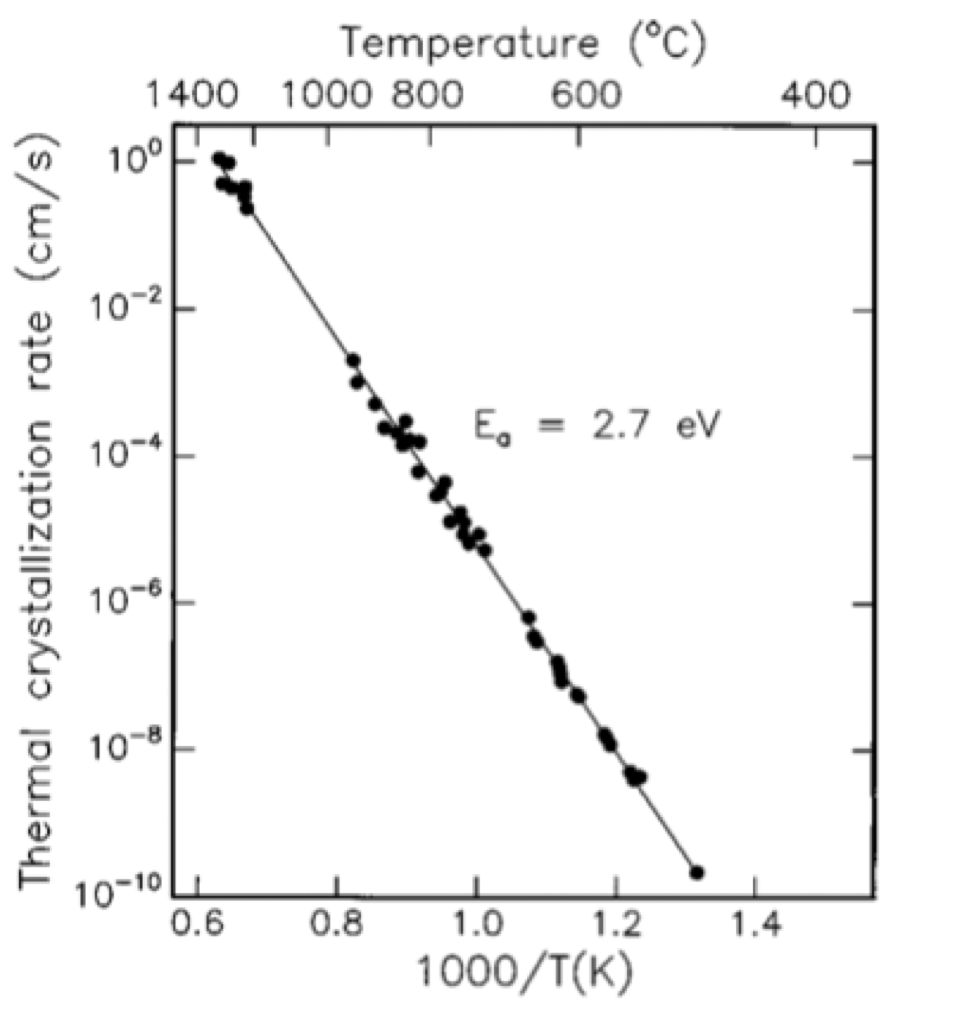
‘A’ is a constant of proportionality, ‘Ea’ is the activation energy, ‘kB’ is Boltzmann’s constant, and ‘T’ is the absolute temperature. In our system, we are trying to describe the growth of pores as a function of annealing temperature. In crystallization theory, the Arrhenius plot shows the crystallization rate versus annealing temperature. Below is one such plot showing the temperature dependence of epitaxial crystallization of a-Si on a <100> silicon substrate (C. Spinella, et al, J. Appl.Phys., vol. 84, pp. 5383-5414, 1998.).
If we make a similar plot with average diameter growth versus temperature, we find that a similar relationship exists.
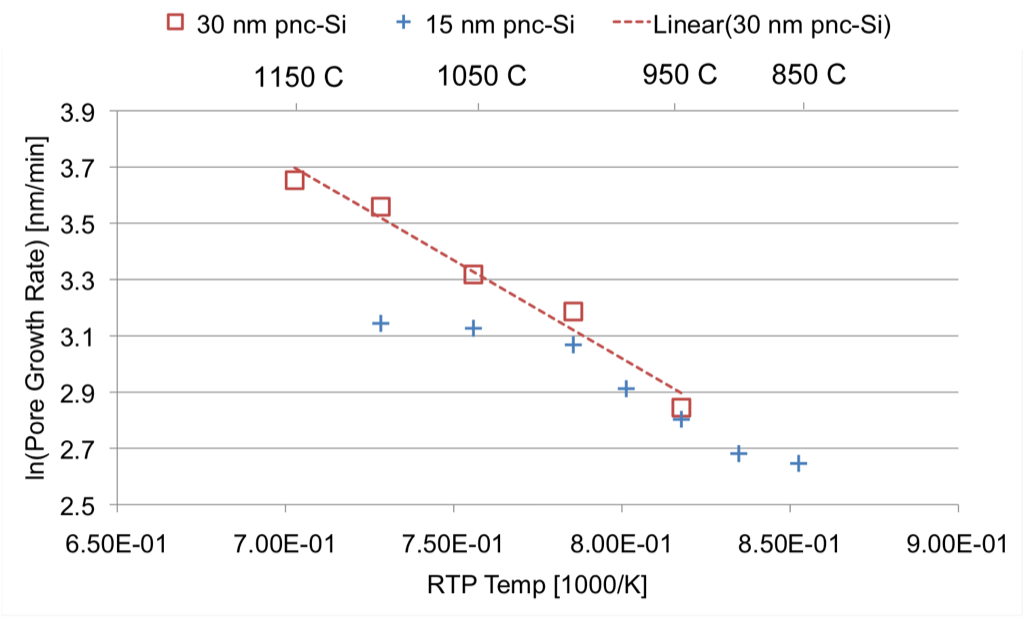
From the slope of the 30 nm sample, we find that Ea = 0.6 eV. In the annealing temperatures shown, the growth rate of the 30 nm film is strictly linear – which is not the case with a thinner film. The 15 nm sample exhibits a slow onset of growth at low temperatures, a linear region, and a saturation point. The linear region represents the condition in which a-Si is still being converted to nc-Si along with void formation. The saturation point is, what I assume to be, the thermodynamic limit of crystal, and hence pore, growth due to the constraint at the Si/SiO2 interface.
Worthy of note is the fact that the slope is very similar in both the 15 nm (linear region) and 30 nm samples. We would expect this to be the case since the “source” material (a-Si) was similar, so we would expect the energy needed to grow the pores would be similar. To vary the activation energy, we could do several things to the change the initial state of the a-Si, such as changing the substrate bias or temperature.
There’s still a huge parameter space to explore, and we are in the fortunate situation where we can control the initial “state” of the amorphous silicon, which we have seen to have a huge effect on pore morphology. Let this be a teaser for a future journal club on crystallization and pore formation dynamics!
This is a good start, Dave. I am convinced this eventually will be the right approach.
Terrific. I’ve always imagined a molecular model, but a thermodynamic approach does seem like the right place to start. Your approach assumes pore sizes are proportional to crystal sizes. We’ve been saying this based on EMs, and you argued in your proposal defense that we couldn’t quantify crystal sizes from EMs. I wish we could since it would avoid the assumption. Lets discuss this some more in group meeting.