PKH Paper Final Analysis and Figures
Hello Everyone,
This is an update on all my experiments and analysis on PKH paper. As i had a post before about PKH nanoparticles and PKH-Exosome fusion after labelling, we’ve been working on analysis and finishing figures for this paper.
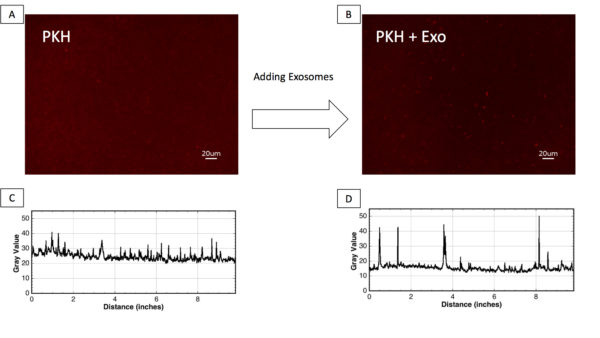
Figure 1;Observation of PKH nanoparticles by fluorescent imaging. A and B) Fluorescent images of PKH-labelled exosome-free control (PKH) and PKH-labelled exosomes (PKH+Exo). C and D) line profile analysis of PKH-labelled exosome-free control (PKH) and PKH-labelled exosomes (PKH+Exo).
Take Home Point:
- Fluorescent Images showed the presence of PKH nanoparticles in the PKH-labelled exosome-free control (PKH), while larger nanoparticles were found in the PKH labelled exosomes sample.
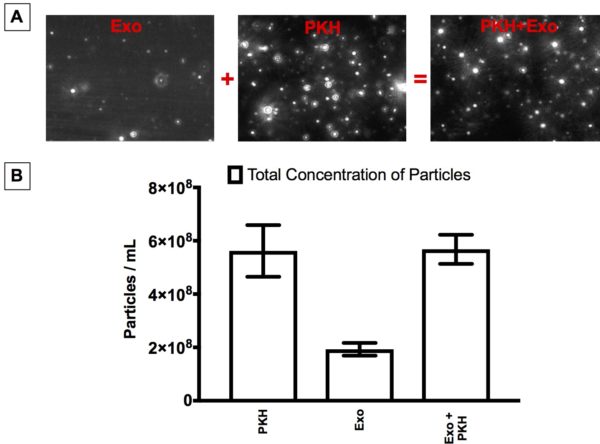
Figure 2;Particle concentrations by Nanoparticle Tracking Analysis (NTA). A) NTA video frames of Exosome control (Exo), PKH-labelled exosome-free control (PKH), and PKH-labelled exosome sample (PKH+Exo). B) Concentration measurements of Exosome control (Exo), PKH-labelled exosome-free control (PKH), and PKH-labelled exosome sample (PKH+Exo).
Take home points:
- Nanoparticle Tracking Analysis (NTA) showed the presence of nanoparticles in Exosome control (Exo).
- Nanoparticle Tracking Analysis (NTA) showed the Possibility of fusion of PKH nanoparticles with exosomes.

Figure 3;Effect of exosome concentrations on the size distribution of particles in PKH-labelled exosome samples by Nanoparticles Tracking Analysis (NTA). (A-D); Size distribution of PKH-labelled exosome samples with different exosome concentrations (0.03, 0.3, 1.5, and 4.5 µg/mL).
Take home point:
- Higher concentrations of larger particles were detected in the PKH-labelled exosomes samples.
- The size mode was shifted towards larger particles for PKH-labelled exosomes samples (PKH-Exo).
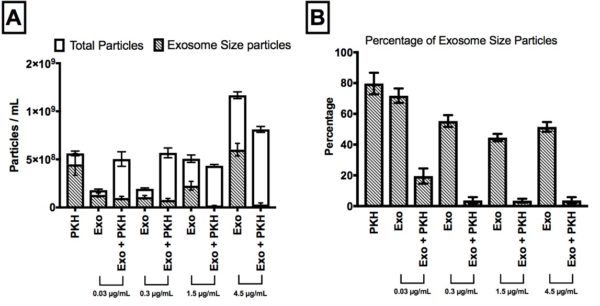
Figure 4;Quantitative determination of the effect of exosome concentrations (0.03, 0.3, 1.5, and 4.5 µg/mL)on the nanoparticle concentrations in PKH-labelled exosomes by Nanoparticles Tracking Analysis (NTA). A) Concentration analysis before and after adding different concentration of exosomes to the PKH-labelled exosome free control (PKH). B) Percentage of exosome-size particles in total number of particles for different concentrations of exosomes.
take Home Points:
- For all concentrations of exosomes, the binding/fusion of exosomes and PKH nanoparticles was observed by NTA.
Table 1;Summary of the concentration and size analysis for different exosomes concentrations (0.03, 0.3, 1.5, and 4.5 µg/mL).

We also did some experiments on different concentration of PKH, i am still working on the figures.
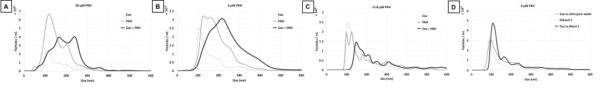
Figure 5;Effect of exosome concentrations on the size distribution of particles in PKH-labelled exosome samples by Nanoparticles Tracking Analysis (NTA). (A-D); Size distribution of PKH-labelled exosome samples with different exosome concentrations (20, 4, 0.16 and 0 µM).
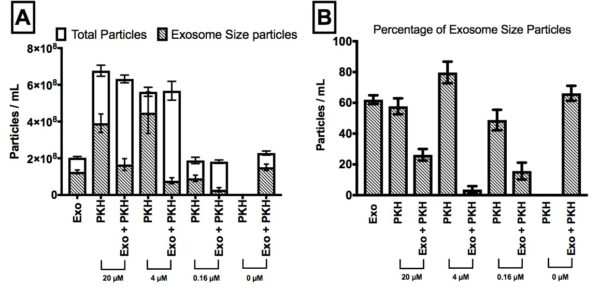
Figure 6;Quantitative determination of the effect of PKH concentrations (20, 4, 0.16 and 0 µM) on the nanoparticles concentration in PKH-labelled exosomes samples by Nanoparticles Tracking Analysis (NTA). A) Concentration analysis before and after adding 0.3 µg/mL exosomes (exo) to different concentrations of PKH samples (PKH) B) Percentage of exosome-size particles in total number of particles for different concentrations of PKH.
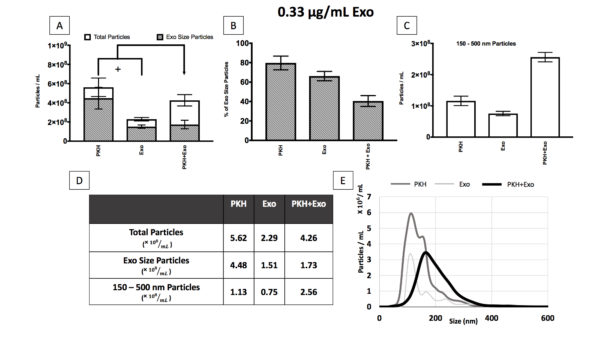
Table 2;Summary of the concentration and size analysis for different PKH concentrations (20, 4, 0.16 and 0 µM).


Supplementary Figure 1;The effect of PBS as a buffer with salts on PKH dyes; A) Total concentration and concentration of exosomes-size particles of PKH in diluent C and PBS. B) Size distribution of PKH in diluent C and PBS samples. C) Total concentration and concentration of exosomes-size particles of exosomes and PKH micelles formed in PBS and mixture of exosomes and PKH micelles formed in PBS. D) Percentage of exosome size particles for exosomes and PKH micelles formed in PBS and mixture of exosomes and PKH micelles formed in PBS. E) Table showing the concentration of exosomes and PKH micelles formed in PBS and mixture of exosomes and PKH micelles formed in PBS F) Size distribution from NTA measurements of exosomes in PBS, PKH in PBS and mixture of exosomes and PKH in PBS.
Take home points;
- Fusion of exosomes and PKH micelles formed in PBS was also observed by NTA.
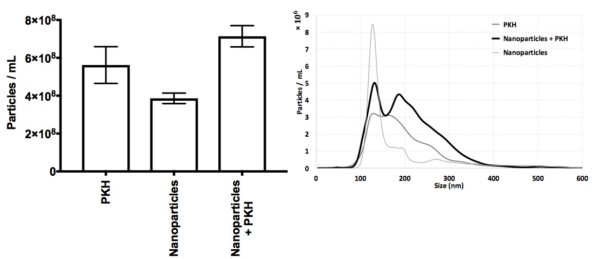
Supplementary Figure 2; Nanoparticles and PKH

Supplementary Figure 3; CFSE labelling of Exosome

Supplementary Figure 4; Exosomes in Diluent C and ultra-pure water
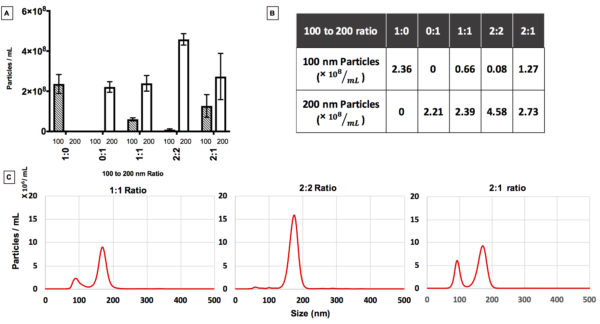
Supplementary Figure 5;The effect of polydispersity on NTA measurements; A and B) Particles concentration for different mixing ratios of 100 and 200 nm particles. C) Size distribution from NTA measurements of mixtures of monodisperse particles.
Take home point:
- Masking effect needs to be considered for polydisperse samples NTA concentration measurements of polydisperse samples.
- Masking cannot be the only reason in concentration analysis of different exosome and PKH samples, since the ratio of smaller particles to larger particles is high which minimizes the effect of masking on the analysis.