hiPSC Differentiation to Endothelial Cell Culture Method, Brain Microvascular Endothelial Cells (EECM-BMEC-like cells), Round 2

Introduction

This post highlights results from my second attempt to differentiate hiPSCs into endothelial progenitor cells  EECM-BMEC-like cells in our lab. For details on methodology, see Nishihara et al., FASEB, 2020 and my previous post.

Methods

Fig. 1. Overview of EECM-BMEC-like cell differentiation protocol. Image adapted from Nishihara et al., FASEB, 2020.

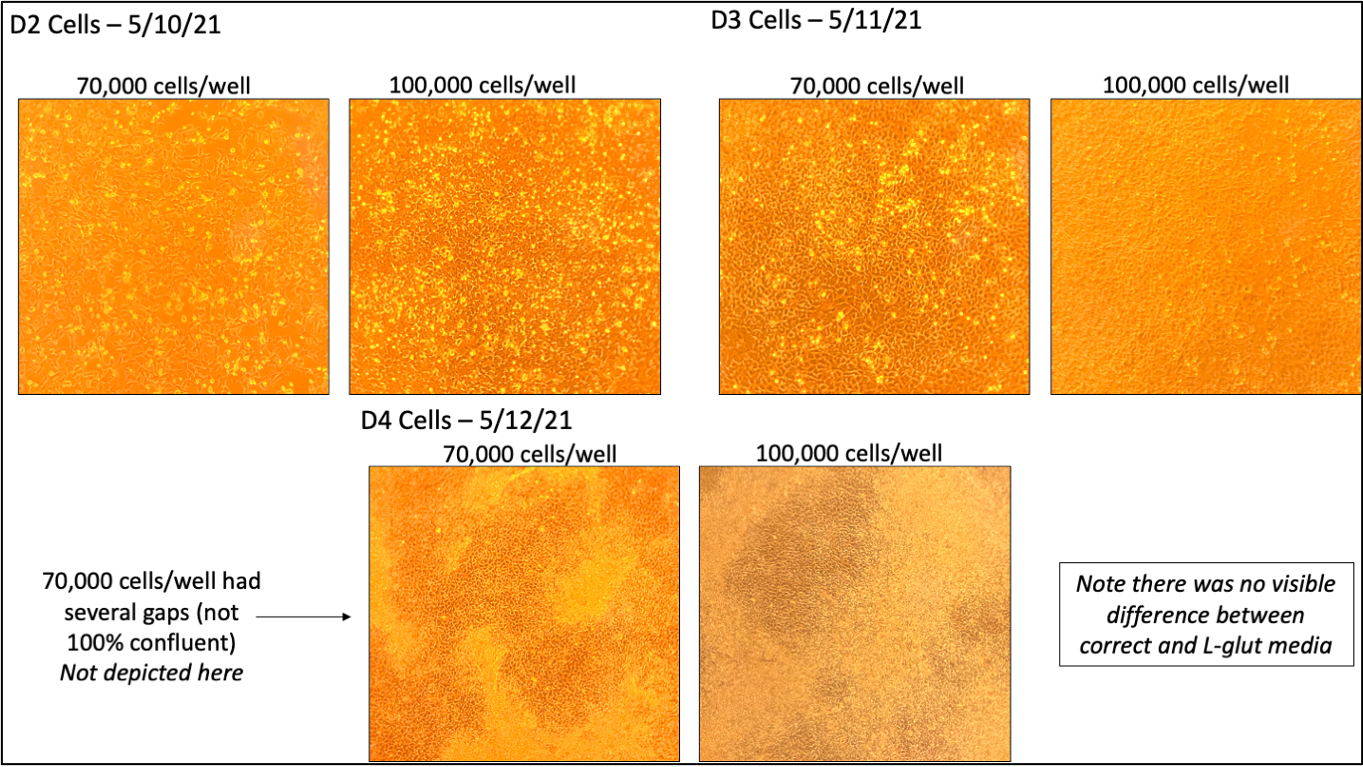
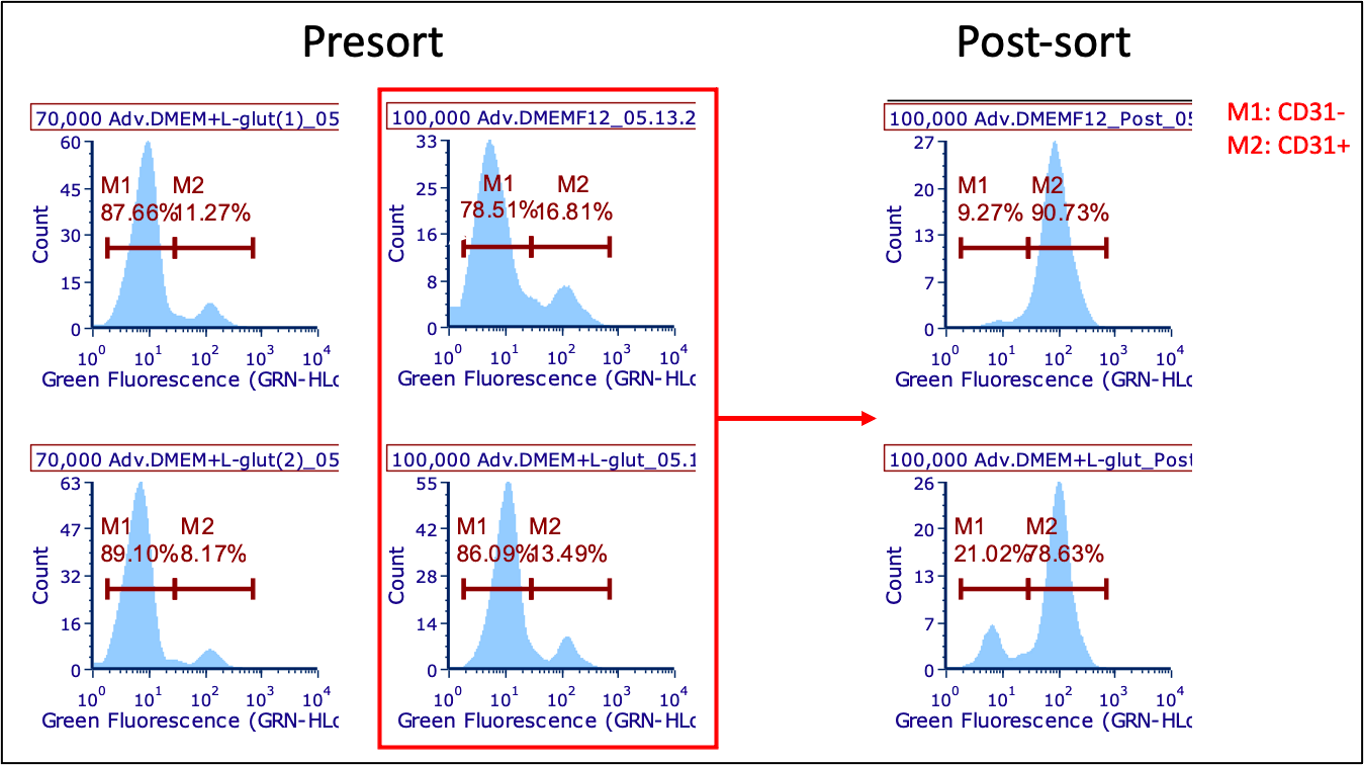
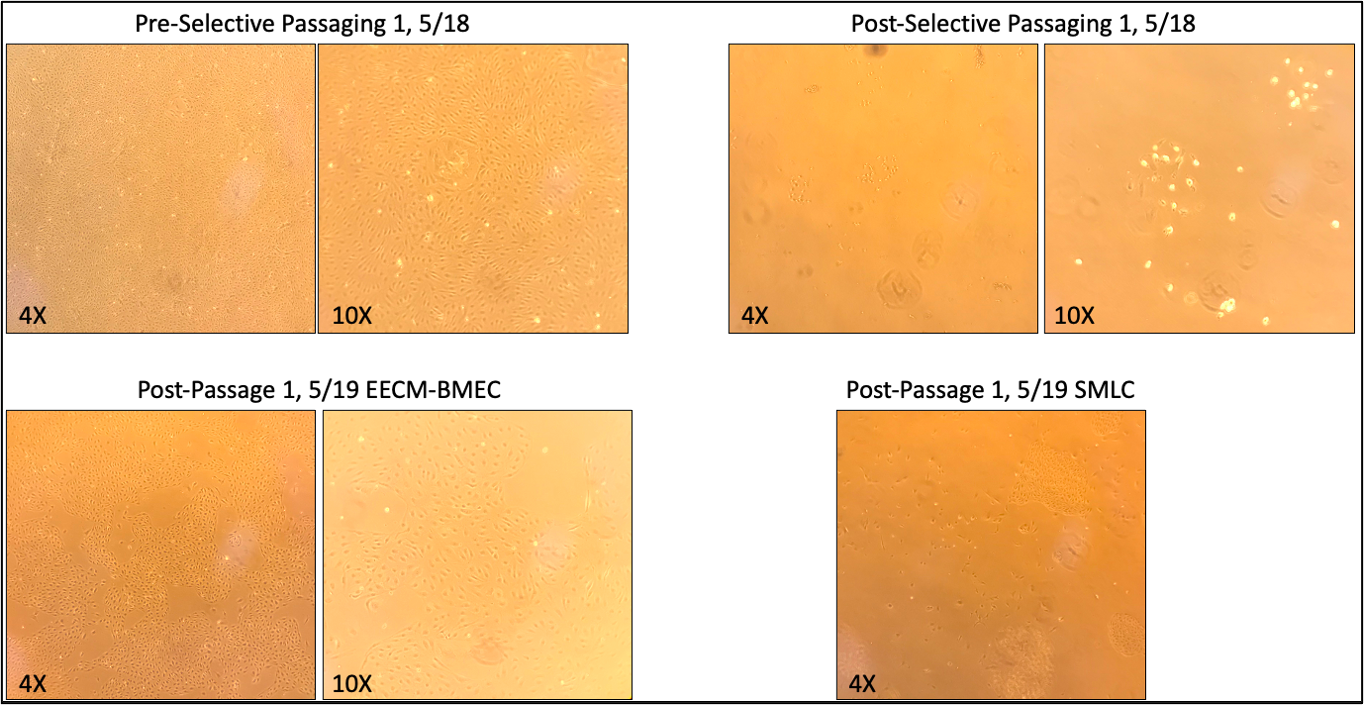
Cells were seeded at 70,000 and 100,000 cells/well on D-3. Only the 100,000 cell/well plate was sorted. Due to media being backordered, some cells were maintained in LaSR made with Advanced DMEM + Ham’s F12 (with L-glutamine), instead of Advanced DMEM/F12 (no L-glutamine). This cells were not used for any analyses. Following MACS, one well was plated at 300,000 cells/well and selectively passaged twice before using for analysis.

At passages 2-4, a subset of cells were seeded into collagen IV (400 μg/mL, dissolved in 0.5 mg/ml acetic acid)/fibronectin (Gibco, 100µg/ml)-coated 6.5mm diameter, 0.4 µm PC Transwell filters at a density of 100,000/cm2 in hECSR medium. TEER measurements were taken daily (EndOhm chamber using EVOM2 system), and permeability was measured after 6 days of culture. Transwell filters were fixed, removed, and stained for ZO-1 to check monolayer maturity. Note that cell growth slowed following passage 4.

At passage 3, a subset of cells were seeded into collagen IV (400 μg/mL, dissolved in 0.5 mg/ml acetic acid)/fibronectin (Gibco, 100µg/ml)-coated µSiMs with single slot NPN membranes (lot 1364) at a density of 15,000 cells/device in hECSR medium. Media was replaced 2 hr after seeding and once the following day. After 2 days of culture, cells were fixed and stained for VE-cadherin (R&D Systems), PECAM-1 (Thermo, PA5-32321), Claudin-5 (Thermo 35-2500), Occludin (Thermo 35-1500), and ZO-1 (Thermo 40-2200).

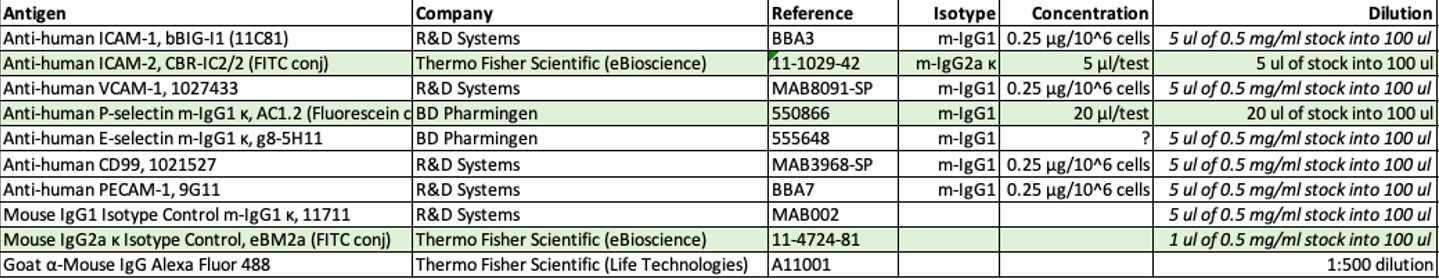
At passage 4, cells were seeded into a collagen IV (10 μg/mL)-coated 24 well plate at a density of 95,000 cells/well and cultured for 3 days. After two days of culture, hECSR was replaced with SMLC-CM with or without 1 ng/mL of recombinant human TNF-α (R&D Systems) and 20 IU/mL recombinant human IFN-γ (R&D Systems). Proinflammatory stimuli were maintained approximately 20 hours before cell adhesion molecules analyzed (Guava EasyCyte Flow Cytometer). THE PLATE WAS DROPPED DURING SECOND WASH, CAUSING SPILLOVER BETWEEN WELLS AND CELL LOSS.

Fig. 2. Antibodies used for flow cytometry analysis. New P-selectin and E-selectin antibodies were purchased (same ones used in Nishihara et al). The rest of the antibodies are the same as those used in round 1 of differentiation.

During passages 3 and 4, 1-2 x 10⁶ cells were resuspended in 1 ml freezing media (hECSR supplemented with 30% FBS, 10% DMSO, and 5 µM Y-27632) and frozen for future use.

Results

Fig. 3. Differentiation to EPC. iPSC(IMR90)-4 were seeded on Matrigel-coated plates in mTeSR1 medium at varying cell densities and grown 3 days. On D0, media was switched to LaSR + 8 μM CHIR99021 and maintained for two days, and then medium was switched to LaSR without CHIR99021 for three days. Because we ran short on LaSR and the Advanced DMEM/F12 (no L-glutamine) was backordered, 3 out of 4 plates received combined Advanced DMEM and Ham’s F/12 (with L-glutamine) on D3 and D4. Brightfield images were taken at 10X magnification.
Fig. 4. EPC differentiation efficiency. Prior to MACS, cells were incubated with FITC-conjugated CD31 antibody and differentiation efficiency was measured. The 100,000 plates had a high enough population of CD31+ cells, to continue with MACS, whereas the 70,000 plates did not and were tossed. Post MACS, the plate containing cells grown in the proper media had high sorting efficiency, whereas the plate grown in media with L-glutamine had poorer sorting efficiency.
Fig. 5. Differentiation to naïve EC. EPCs were seeded on collagen IV-coated 6 well plates at 3 x 10^5 cells/well and grown to confluency. The plate containing cells grown in the proper media had mostly naïve ECs, whereas the plate grown in media with L-glutamine had largely non-EC populations. ECs from the correct media plate were selectively passaged to remove non-ECs and matured to EECM-BMEC-like cells. SMLCs were maintained to collect SMLC-CM for cytokine stimulation experiments.
Fig. 6. Differentiation to mature EECM-BMEC-like cells. ECs from the 100,000 cell/well plate were selectively passaged one more, and then passed two more times onto collagen IV-coated 6 well plates at 2 x 10^5 cells/well once they reached confluency. Cells became elongated, similar to the morphology reported. Cells at passage 3 were subcultured into µSiMs for junctional stains and at passage 4 were subcultured into a 24 well plate for analysis of cell adhesion molecules following proinflammatory stimulation. Brightfield images were taken at 4X or 10X magnification.
Fig. 7. TEER and permeability analysis on EECM-BMEC-like cells. At each passage, cells were cultured on collagen IV/fibronectin-coated Transwells and grown 6 days. TEER was taken daily (A) and permeability to sodium fluorescein (NaFl) was assessed on D6 (B). (A) Plotted data are mean TEER values ± SD. Data are from one independent differentiation (n=3 for each passage). (B) NaFl (0.37 kDa) permeability bars show the mean permeability coefficients (Pe) ± SD. Data are from a single independent differentiation (n=3).

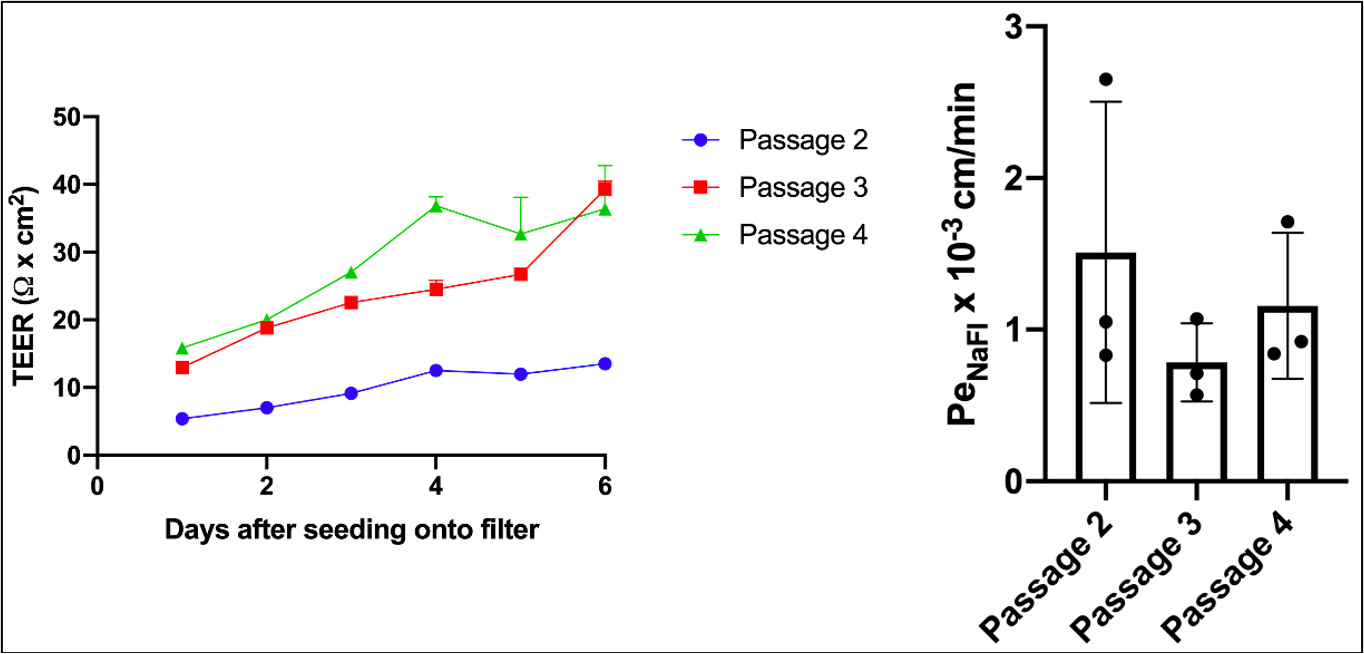
TEER was improved compared to the previous experiment, but still lower than reported in Nishihara et al. Permeability was near the published values obtained for IMR90-4 (~0.7 x 103 cm/min), but below what Hideaki has achieved with this cell line (≤0.5 x 103 cm/min).

Fig. 8. Representative images of ZO-1 staining of cell cultured in Transwell filters following permeability analysis. Cells were stained with ZO-1 (red) and hoechst (blue), and imaged on an Andor Dragonfly Confocal Microscope. Scale bars are 300 µm (top) and 100 µm (bottom).
Fig. 9. ICC analysis on P3 EECM-BMEC-like cells. At passage 3, cells were subcultured into collagen IV/fibronectin-coated µSiMs and grown 2 days. Cells were stained with VE-cadherin (green), PECAM-1 (red), claudin-5 and occludin (green), and ZO-1 (red), and imaged on an Andor Dragonfly Confocal Microscope. Representative images for each marker are shown. Scale bars are 100 µm.

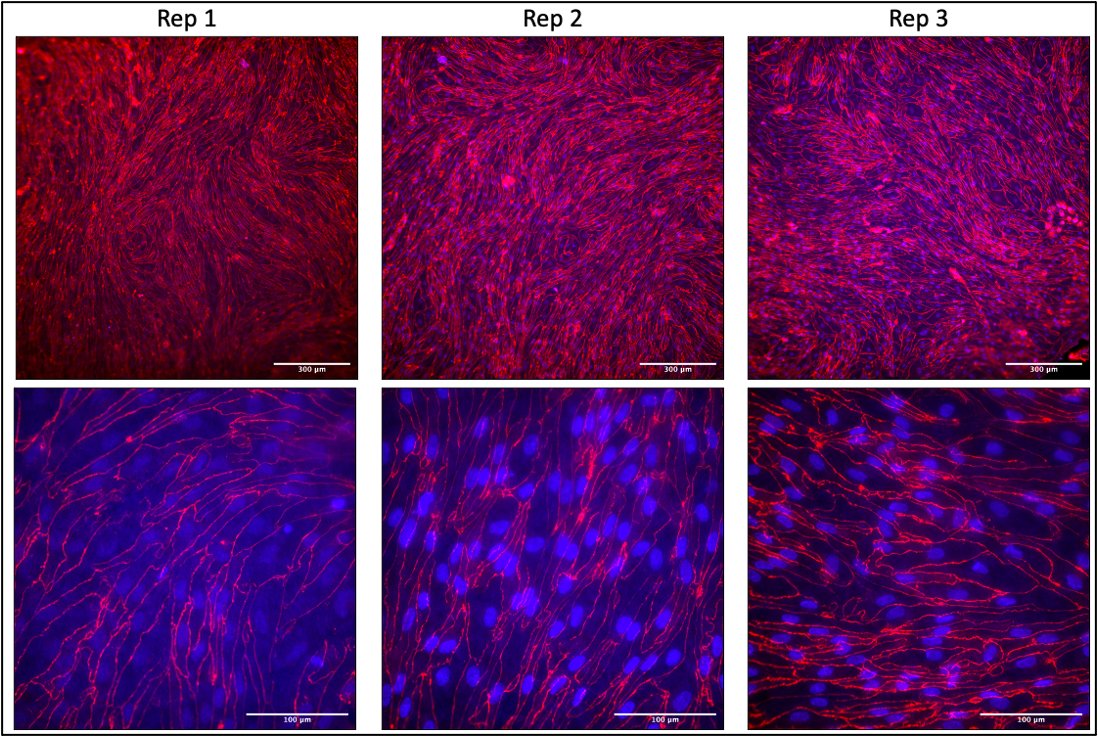
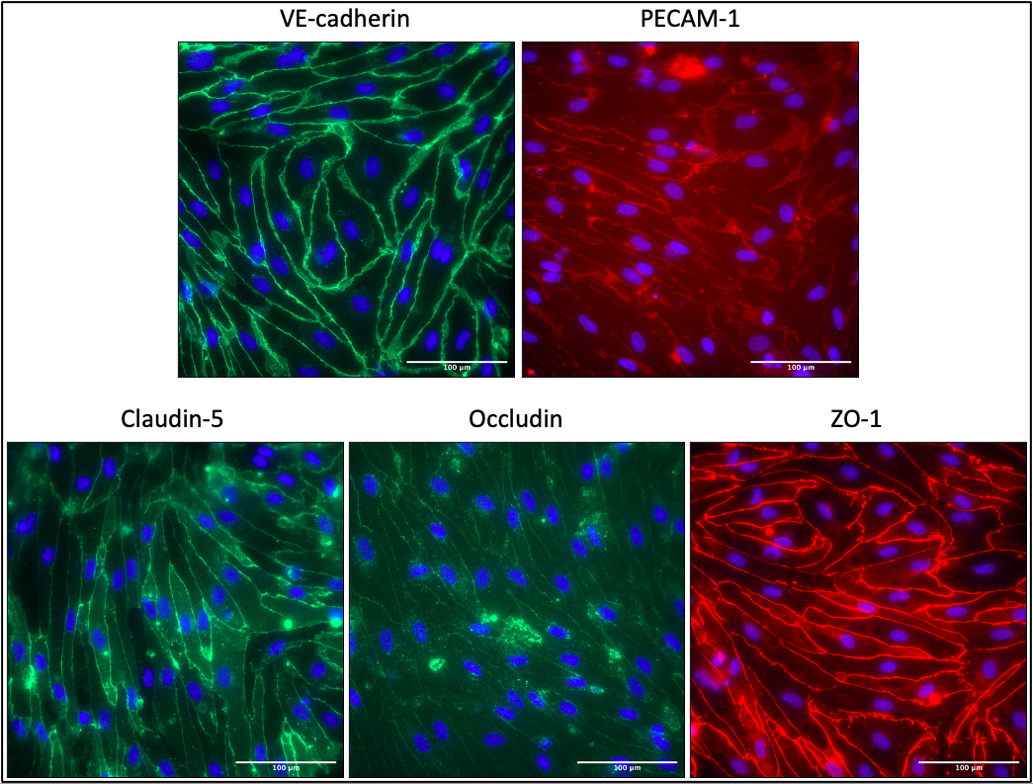
Cells express all junctional molecules, comparable to what is seen in Pelin’s post.

Fig. 10. Cytokine stimulation and flow cytometry analysis of adhesion molecules. TNF-α and IFN-γ stimulated and non-stimulated (NS) controls were analyzed for cell surface expression of ICAM-1, ICAM-2, VCAM-1, P-selectin, E-selectin, CD-99, and PECAM-1. Isotype control (gray), nonstimulated (NS, blue), and 20 hour pro-inflammatory cytokine-stimulated (1 ng/mL TNF-α + 20 IU/mL IFN-γ, red) are represented in a histogram overlay. NOTE: The plate was dropped and wells were mixed/cells lost during the final wash step.

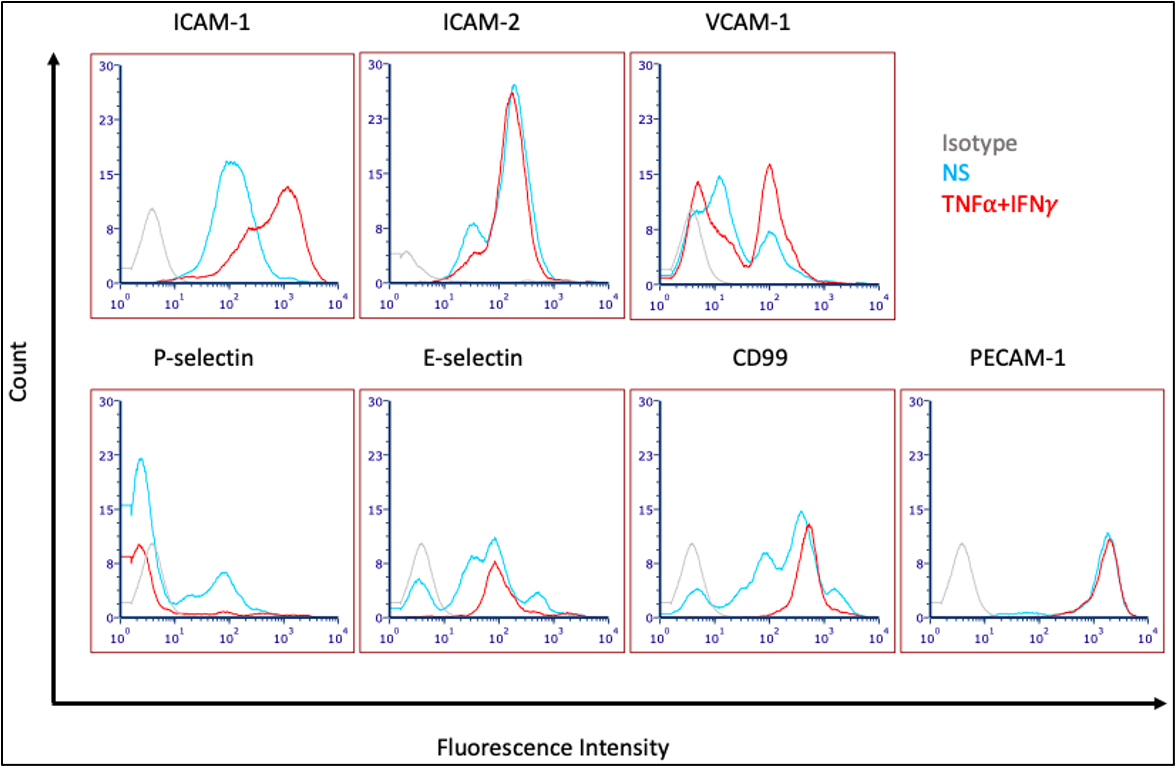
Data is hard to interpret due to the plate being dropped and wells contaminating each other. It is unclear whether we see VCAM-1 expression with culturing in SMLC-CM and unclear if we have expression of selectins, measured with the new antibodies. Data is suggestive that we at least have E-selectin expression now, and possibly VCAM-1 and P-selectin expression, but this experiment will need to be repeated.

Conclusions

This second round of EECM-BMEC-like cell differentiation was an improvement from the first round, with better expression of junctional markers and lower permeabilities/higher TEER. Next experiment, I will not do TEER and, instead, culture cells on 12 well format Transwell filters rather than 24 well format filters to see if surface area makes a difference on permeability. Further, purer EECM-BMEC populations were obtained, and two vials of EECM-BMECs were frozen for future use. These vials will be used to repeat flow cytometry of cell adhesion molecules following proinflammatory stimulation, in addition to ICC on cell adhesion molecules following proinflammatory stimulation of cells cultured in µSiMs.

Similar Posts