Gold Separation Wafer Statistics
Here is the analysis of the wafers used in the pressurized gold separations:
SC 199

| Stat | Result |
| Mean Equiv Diameter | 17.84 nm |
| Median Diameter | 18.30 nm |
| Porosity | 2.2% |
| Weighted Mean Diameter | 20.81 nm |
| 90% Diameter | 26.64 nm |
| Roundness | .782 |
Separates 10 nm from 15 nm
w225

| Stat | Result |
| Mean Equiv Diameter | 18.33 nm |
| Median Diameter | 18.81 nm |
| Porosity | 6.2% |
| Weighted Mean Diameter | 20.24 nm |
| 90% Diameter | 24.95 nm |
| Roundness | .797 |
Separates 5 from 10
The mean, median, and weighted diameters are all very similar for these wafers. The 90% diameter is ~2 nm higher for 199, which had the higher separation. Porosity is significantly different, with 199 having very low porosity.
I’ve performed flow rate predictions on these two wafers, and I’ve calculated the cumulative permeability. The results show that the large pores play a much bigger part in the total permeability of 199 than 225, even though 225 is expected to have a higher permeability.
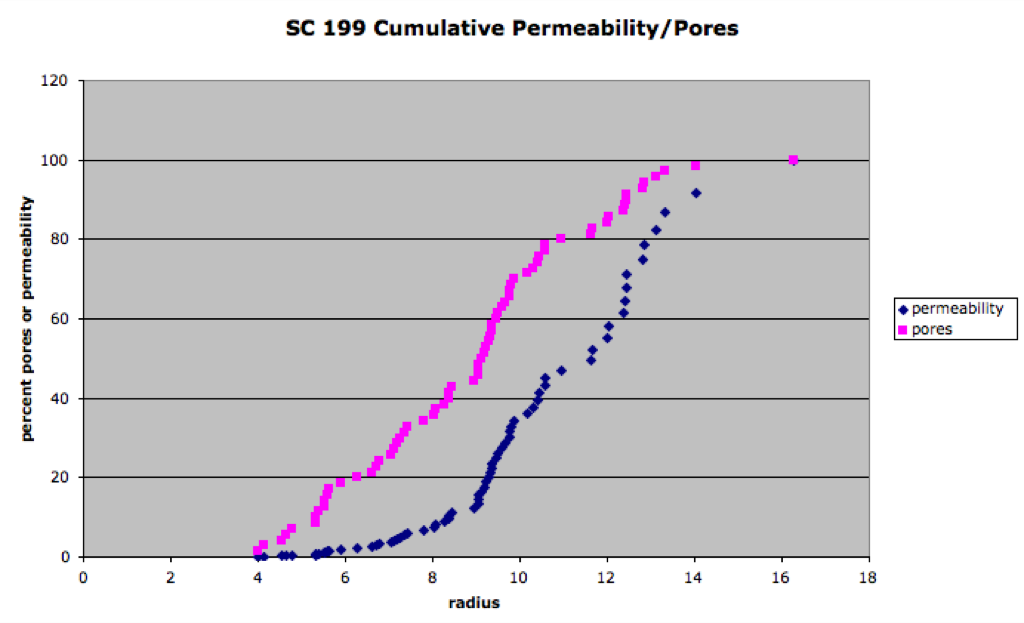
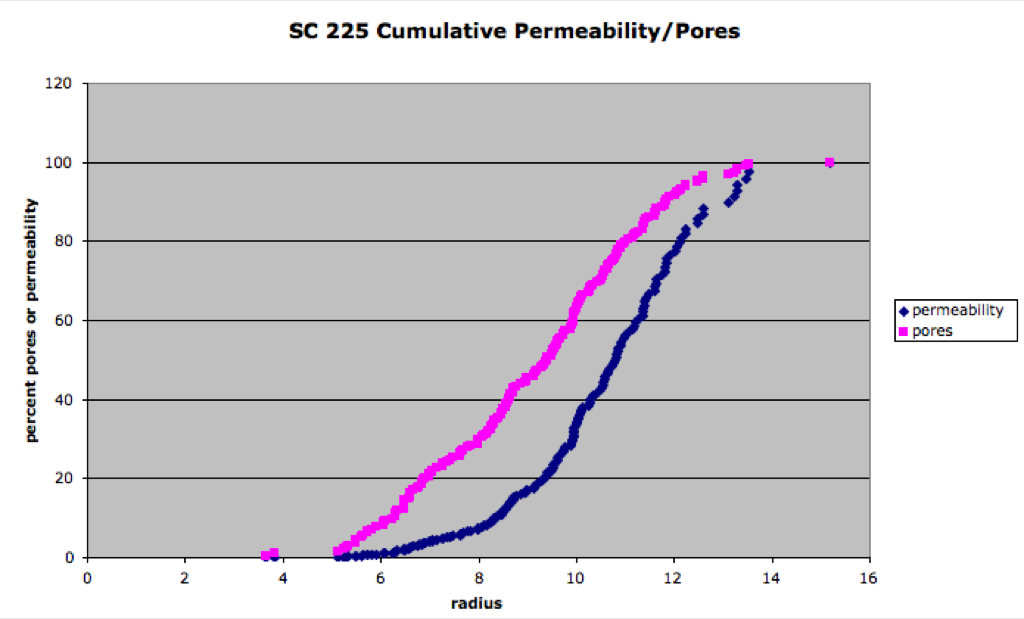
As a reminder, these figures show the cumulative percent of pores and the cumulative percent of permeability at each radius. In the 199 figure, the largest 20% of pores represent 50% of the permeability. For 225, the largest 20% represent 40% of the permeability.
These two wafers have similar histogram characteristics, except for porosity, but have very different separations. The percent permeability contribution I mentioned above or effect from membrane charges may result in the different observed separations.
Total Theoretical Permeabilities:
199 – 6.73 cc/min-bar-cm2
225 – 17.93 cc/min-bar-cm2
I’m still a little suspicious about these membranes and think that it would be a good idea to measure outer and inner samples from both wafers side-by-side on the TEM. It would not take long, and knowing that there are substantial differences in permeability would inspire us to look around the membranes a little more. Approx how many samples from each of these wafers have been tested? Have the results been fairly consistent across the board? Any anomalies or subtle differences between these wafers that have been noted? Are the wafers physically scribed so there is no doubt that the numbers are correct?
Thanks Jess for doing this- but I am still unclear as to what strong conclusions, if any, we can draw from this set of experiments. Couldn’t we re-do the experiments with different membranes that would have more differentiated cutoffs or mean pore diameters? Again, the purpose of these experiments is to show size-based separation, right? If so, then the two membranes are too close in properties. For publication of the first results, we should focus on a more clear difference in membrane properties (but a smaller difference than with any other technology) – a longer paper could then follow, with data that would attempt to differentiate between more similar membranes. What do you and others think?